
The 9-th is named “evil”, and the description says:
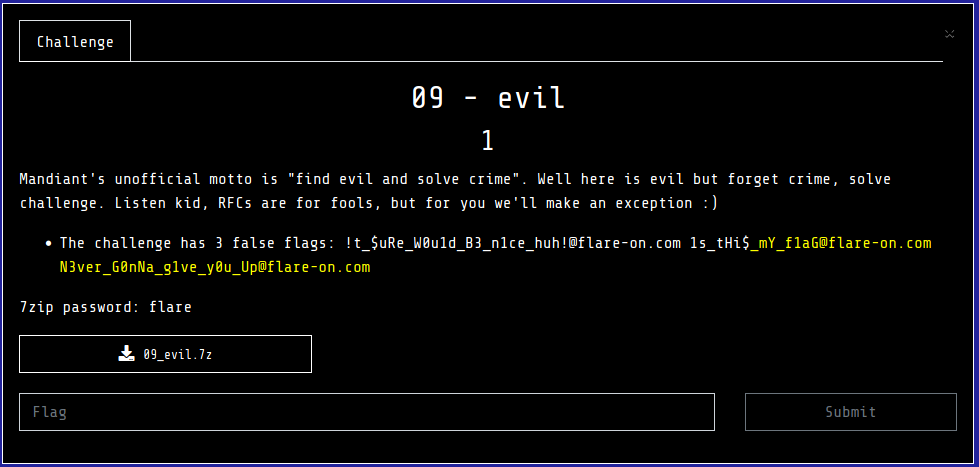
As mentioned, it comes with several false flags, so we need to watch out!
It is a Windows executable, 32-bit.
Overview and understanding the goal
Running the task doesn’t give us much information, because no output is displayed.
Opening it in IDA shows that the code is obfuscated: we can see some invalid chunks in between of code:

Due to this we IDA can neither decompile it, nor create graphs.
If we load it under x64dbg, we can see that the application keeps throwing exceptions:

We can step through them, and finally it reaches a far return:

Far returns are often used in Heaven’s Gate technique. However, here it is not the case, and the presence of it doesn’t make much sense. So it indicates that probably the debugger was detected and we went into a wrong execution path.
We can try once again, by setting x64dbg to ignore the exceptions:

Now, the debugger won’t stop at the exceptions, but it doesn’t help much: the application will soon terminate.
The next thing I did was tracing it with TinyTracer. Some trace is being produced, but again it breaks at the invalid far return:
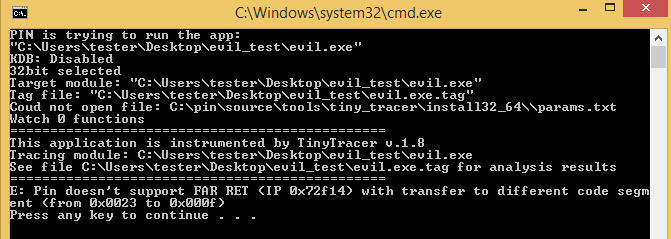
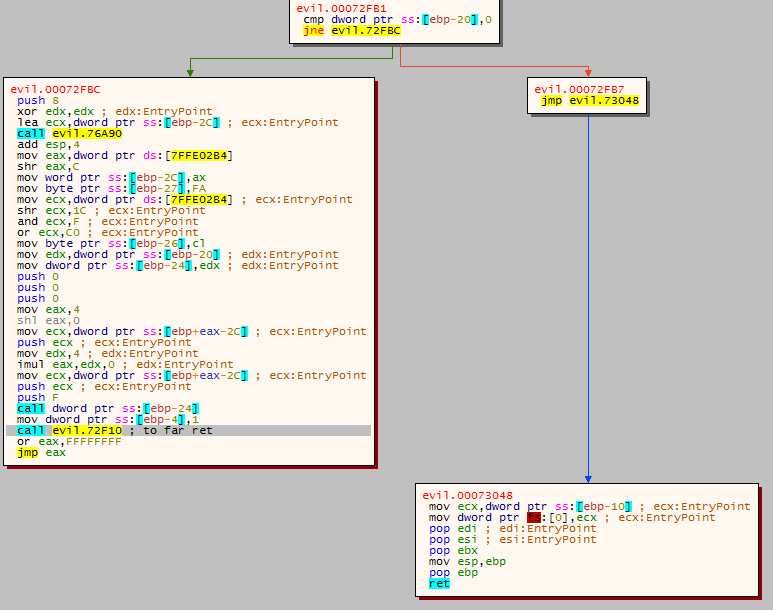
It happens at the same RVA as the debugger show before: 0x2F14. Once again in x64dbg, we can see the path that leaded to that invalid instruction:
Patching (#1)
A simple patch can help avoid going this way: NOPing out the conditional jump:

Patch:
RVA: 2fb5 -> NOP
Tracing the patched application
The above patch finally caused the trace to go much further.
Yet, it is worth to note that not all my attempts of tracing gave the same results: in some it was clear the application terminates immaturely. So, it made me guess that the defensive checks are somehow randomized. This was later confirmed with a static analysis, and will be described further in this blog.
Not seeing that the application reads any input, I tried to trace it with some commandline argument (I used “Test123”). This turned out to be a good idea, as we could observe on the trace that the execution goes further. I obtained the following log: log1.tag.
The application terminates soon, yet, towards the end of the log, we can see some interesting calls, related to socket creation:
3ac5;ws2_32.inet_addr
3af7;ws2_32.WSAStartup
3b20;ws2_32.socket
5002;ws2_32.WSAGetLastError
676c;ws2_32.WSACleanup
Seeing it, I suspected that opening of the socket has failed. I traced it again, but this time with tracking parameters of those functions.
Relevant fragments of the trace show that the commandline argument was used as a socket address:
...
3ac5;ws2_32.inet_addr
	Arg[0] = ptr 0x00755000 -> "Test123"
Then, by checking the arguments passed to the function socket, we can see that the created socket is of the type raw, and dedicated to UDP communication:
3b20;ws2_32.socket
	Arg[0] = 0x00000002 = 2 // AF_INET
	Arg[1] = 0x00000003 = 3 // SOCK_RAW
	Arg[2] = 0x00000011 = 17 // IPPROTO_UDP
Since the application will be opening a raw socket, need to be run as an Administrator.
I changed the commandline argument to “127.0.0.1”, and traced it again, this time as an Administrator. The following alert shows up:
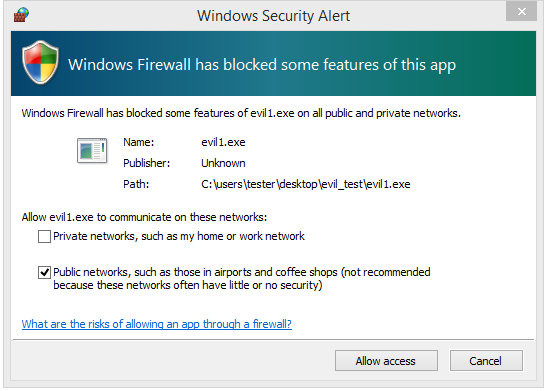
This time the application runs further. In the log we can see the calls to other functions related to the socket:
3b60;ws2_32.bind
3bb4;ws2_32.WSAIoctl
3c0b;ws2_32.setsockopt
3c35;ws2_32.socket
3c79;ws2_32.setsockopt
43b7;ws2_32.recvfrom
Fragments of the trace with added parameters tracking:
3ac5;ws2_32.inet_addr
	Arg[0] = ptr 0x00b233a8 -> "127.0.0.1"

3b20;ws2_32.socket
	Arg[0] = 0x00000002 = 2
	Arg[1] = 0x00000003 = 3
	Arg[2] = 0x00000011 = 17

3b60;ws2_32.bind
	Arg[0] = 0x0000028c = 652
	Arg[1] = ptr 0x008bf9b4
	Arg[2] = 0x00000010 = 16

3bb4;ws2_32.WSAIoctl
	Arg[0] = 0x0000028c = 652
	Arg[1] = 0x98000001 = 2550136833
	Arg[2] = ptr 0x008bf9dc
	Arg[3] = 0x00000004 = 4

3c0b;ws2_32.setsockopt
	Arg[0] = 0x0000028c = 652
	Arg[1] = 0x0000ffff = 65535
	Arg[2] = 0x00001006 = 4102
	Arg[3] = ptr 0x008bf9c8
	Arg[4] = 0x00000004 = 4

3c35;ws2_32.socket
	Arg[0] = 0x00000002 = 2
	Arg[1] = 0x00000003 = 3
	Arg[2] = 0x00000011 = 17

3c79;ws2_32.setsockopt
	Arg[0] = 0x00000290 = 656
	Arg[1] = 0
	Arg[2] = 0x00000002 = 2
	Arg[3] = ptr 0x008bf9dc
	Arg[4] = 0x00000004 = 4

43b7;ws2_32.recvfrom
	Arg[0] = 0x0000028c = 652
	Arg[1] = ptr 0x00b753f0
	Arg[2] = 0x000005dc = 1500
	Arg[3] = 0
The other important things is, the socket expects a buffer of maximal length 1500 bytes:
43b7;ws2_32.recvfrom
	Arg[0] = 0x0000028c = 652
	Arg[1] = ptr 0x00b753f0 // buffer pointer
	Arg[2] = 0x000005dc = 1500 // buffer lenght
	Arg[3] = 0
At this point we can suspect that this buffer is the input of our crackme that will take part in obtaining the flag. For communicating with the socket, we can use nping. Example:
nping --udp -p 1234 --dest-ip 127.0.0.1 -c 1 --data [test_data:in hex]
But understanding what exactly should be sent in the buffer will require some code deobfuscation…
Self-modifying code
I decided to run the crackme again (as an Administrator, with the argument “127.0.0.1”), and scan it with PE-sieve/HollowsHunter.
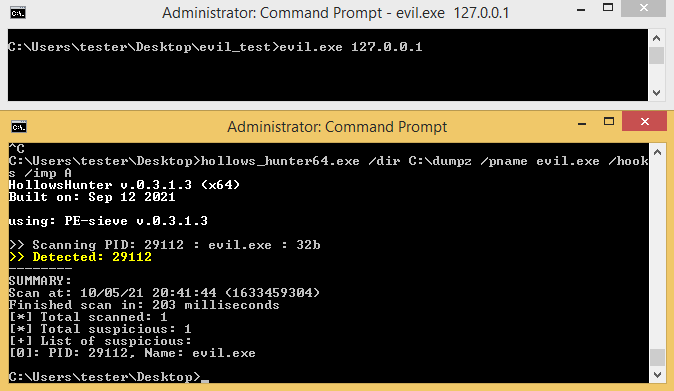
Commandline:
hollows_hunter.exe /pname evil.exe /hooks /imp A
Dumped material:

It turns out that the dumped executable contains a lot of in-memory patches. Basically, the application patches itself as it goes.
Dumping it with the option /imp A gave a sample with a recreated Import Table. This can make a static analysis a bit easier, as (at least some) of the dynamic calls are now replaced with static imports. The other calls, that could not be deobfuscated this way, can be added to IDA by loading the trace log (.tag) via IFL plugin.
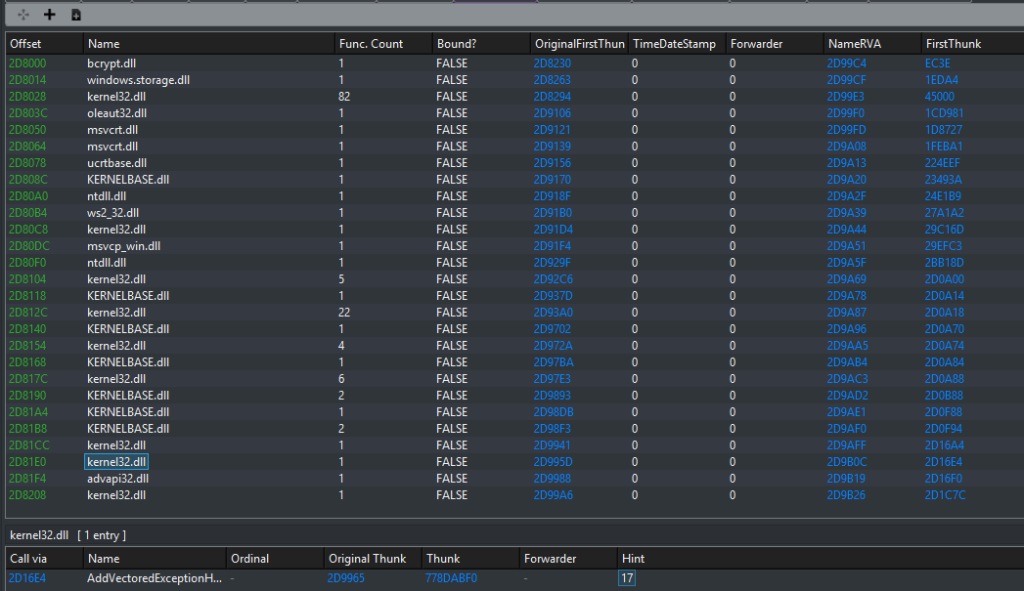
Hooked functions
In advapi32.dll
The dumped material also shows us that advapi32.dll has been hooked. The hook is at the beginning of the function CryptImportKey and it redirects to the crackme. The relevant TAG file:
16cf0;CryptImportKey->760e0[70000+60e0:evil.exe:1];5

Looking at the hook target in IDA we can see the following trampoline function:
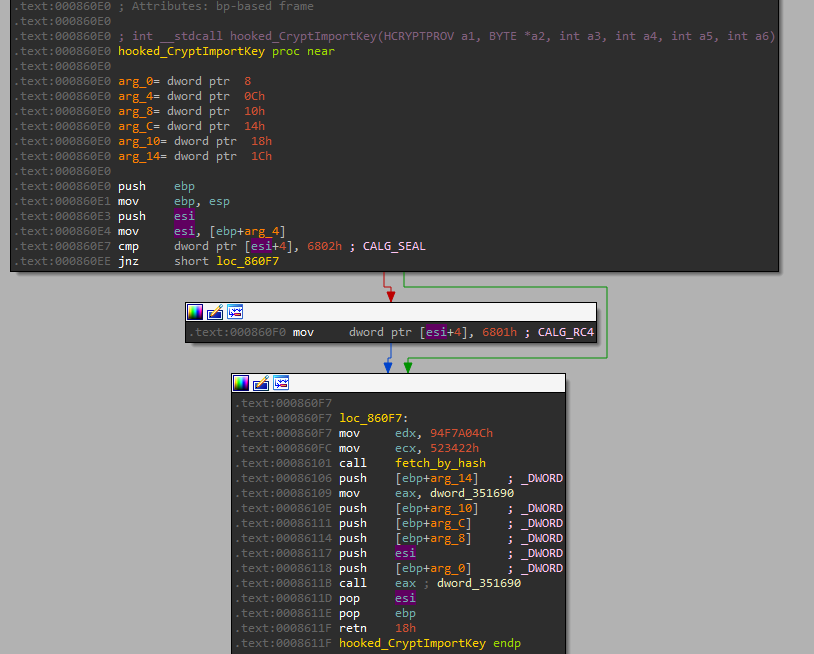
Its role is very simple: if the CryptImportKey was called with the parameter CALG_SEAL it will be changed to CALG_RC4. It suggests that the crackme is gonna use RC4 function to decrypt something (possibly the flag).
In ntdll.dll
There are also patches in ntdll.dll. The relevant TAG file:
27480;DbgBreakPoint;1
b1611;patch_1;1
b1613;addr_replaced_2->ffffffff;4
b1617;hook_3->7712b930[77110000+1b930:kernel32.dll.TerminateProcess:0];7
The first patch disables the function DbgBreakPoint (a function that breaks into the kernel debugger):

The other patch is set at the beginning of the function DbgUiRemoteBreakin – a function used by a debugger to break into a process. Due to the patch, calling this function causes immediate process termination (function TerminateProcess).

Both of those patches are part of the defensive techniques of the crackme.
Flow modified by exceptions
If we apply the tracelog on the crackme, we can clearly see the points in the code where each exception has been thrown. Such points are represented as calls to the Exception Dispatcher (ntdll.KiUserExceptionDispatcher).
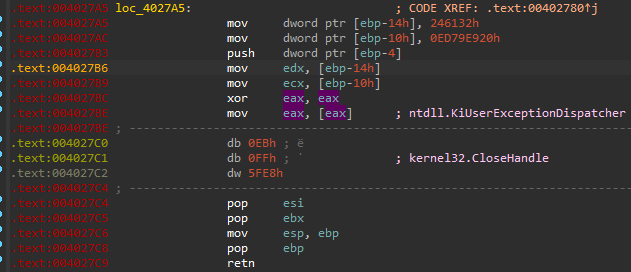
The log also shows that soon after an exception, some API call has occurred: but in the original executable this part of code is invalid. By this observation we can assume, that the exception handler somehow overwritten the invalid bytes, and caused the API call instead.
When we apply the same tracelog, but on the dumped version of the binary, we can see how exactly the written patch looks like:

The full code of the application is sprinkled with various instructions like this, which intentionally cause exceptions.
If we look again into the trace log, we can see that at the beginning of the execution the VEH is being registered. So, when the aforementioned exception is thrown, it is handled by VEH (Vectored Exception Handler). Let’s have a look in IDA:

The function added as a handler:
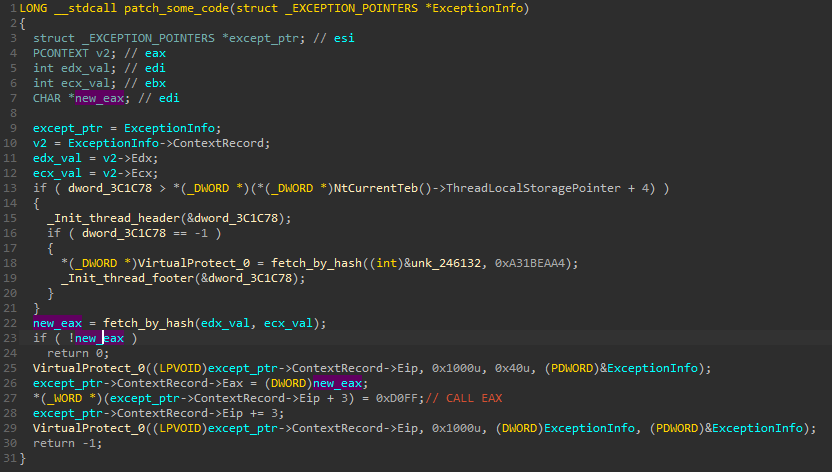
The exception handler fetches values of the registers (ECX, EDX) from the exception context. It passes them to the function that is responsible for resolving address of the API to be called (fetch_by_hash). The obtained address is then stored into EAX of the exception context. After that, we can see the code patching. First, the memory protection at the point where exception was thrown, is set to writable. Then, at EIP + 3 (3 bytes after the point of the exception) the patch is being made: CALL EAX is written. As we know, the EAX contains now the address of the API, so this is what will be called here. The EIP of the exception is set to point to this line, so this will be the next instruction after the exception handler finishes.
Aligning the instructions
The instructions generating the exception (i.e. div eax) are 2 bytes long, while the patch is created with 3 bytes offset. Due to this fact, between the instruction causing the exception, and the newly written CALL EAX there is a trash byte.
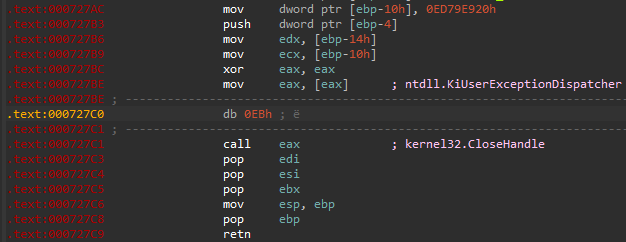
This trash byte destroys the alignment of the instructions, and causes problems to IDA in interpreting the code that follows after (by default it is interpreted as data, and we need to change it manually each time).
In order to fix the alignment, I decided to patch the handler, and make it write aligned instructions. However, the space in the code was too small for making appropriate assembly modifications. So I decided to rewrite the full exception handler, and then hook the function AddVectoredExceptionHandler so that it will set my own version instead of the original one. For hooking I used MS Detours, but any sort of hooking engine will do the job.
The snippet below shows the modified handler:
LONG __cdecl my_patch_some_code(struct _EXCEPTION_POINTERS *ExceptionInfo)
{
    struct _EXCEPTION_POINTERS *except_ptr; // esi
    PCONTEXT v2; // eax
    int edx_val; // edi
    int ecx_val; // ebx
    DWORD new_eax; // edi

    except_ptr = ExceptionInfo;
    v2 = ExceptionInfo->ContextRecord;
    edx_val = v2->Edx;
    ecx_val = v2->Ecx;

    new_eax = resolve_func(edx_val, ecx_val);
    if (!new_eax) {
        return 0;
    }

    VirtualProtect((LPVOID)(except_ptr->ContextRecord->Eip-2), 0x1000u, 0x40u, (PDWORD)&ExceptionInfo);
    except_ptr->ContextRecord->Eax = (DWORD)new_eax;

    *(WORD *)(except_ptr->ContextRecord->Eip + 2) = 0x9090;// NOPs
    *(WORD *)(except_ptr->ContextRecord->Eip + 3) = 0xD0FF;// CALL EAX

    except_ptr->ContextRecord->Eip += 3;
    VirtualProtect((LPVOID)(except_ptr->ContextRecord->Eip-2), 0x1000u, (DWORD)ExceptionInfo, (PDWORD)&ExceptionInfo);
    return -1;
}
As we can see in above code, I replicated the original handler with just one difference: added a NOP instruction before CALL EAX. This will be enough to achieve the main goal: aligning the code. But I decided to still improve it a bit…
The instructions that cause exceptions to be thrown are diversified. Sometimes we can see it is an attempt to read from a NULL address, sometimes a division by 0, and so on. It will be a bit cleaner if we can replace them with only one type: for example by the “read from the NULL address”. So I modified my hook so that it will also replace this part:
// change all exception to follow the same pattern:
if (*(WORD *)(except_ptr->ContextRecord->Eip) != 0x008B) {
  *(WORD *)(except_ptr->ContextRecord->Eip - 2) = 0xC033;// mov  eax, [eax]
  *(WORD *)(except_ptr->ContextRecord->Eip) = 0x008B;// mov  eax, [eax]
}
The code of the full DLL patching the crackme is available here.
It can be injected into the crackme with the help of dll_injector:

The above example shows the most classic way of hooking. Yet, at the time when I was solving this task, I wanted to do multiple experiments and many quick changes in the hooks. So, instead of running the evil.exe in a separate process, and hooking it by injecting a DLL, I wanted something faster: all-in-one loader. The code is available here. This loader requires that first we will convert the evil.exe into a DLL, by EXE_to_DLL. Then, we just load this DLL within the current process, which hooks itself.
Now, the new handler will produce properly aligned instructions: the trash byte has been replaced with a NOP.
However, we need to keep in mind that it modifies the code only as it goes: it will patch only the branches that have been executed. So, the others are still not cleaned. Yet, it is enough to get a decent overview of the code, and the few branches that haven’t been taken can be cleaned later by manual patching (or by an IDA script). Also, by sending various data to the socket, we can cause more branches to be taken, so that more code will be cleaned.
After running the crackme for a while, with the hooked handler, we can dump it again from the memory by PE-sieve, to get the modified version.
Now IDA has no problem with interpreting the modified part of the code:

Understanding the decompiled code
If we managed to get rid of all trash instructions in a certain function, it becomes possible to decompile the code. This makes analysis a lot easier.
We know that the application uses a raw socket, so the buffer that is received by recvfrom contains IPv4 headers, as well as UDP headers (not stripped). Filling those structures in IDA can make interpretation a lot easier.
struct ip_v4
{
_BYTE ver_and_IHL;
_BYTE TOS;
_WORD total_len;
_WORD ID;
_WORD fo_and_flags; // flags : 3 , fragment offset: 13
_BYTE ttl;
_BYTE protocol;
_WORD checksum;
_DWORD source_addr;
_DWORD dst_addr;
};

struct udp_hdr
{
_WORD source_port;
_WORD dst_port;
_WORD len;
_WORD checksum;
};
We can see that the port in the UDP header must be set to a certain value: 0x1104 (4356).
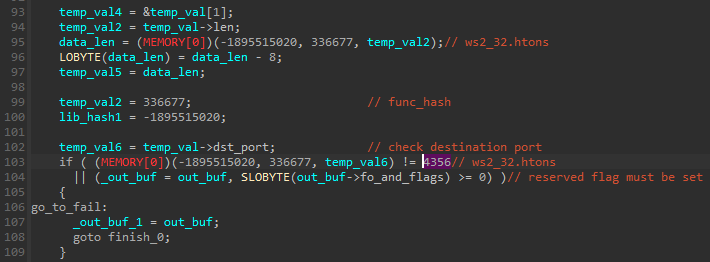
The WORD in IPv4 header that contains bitfields: flags and fragment offset is checked by AND with 0x80. It means the “reserved” flag must be set:

Only if those conditions are fulfilled, the received data will be processed further.
Then, the received data from the packet is rewritten to another, custom structure.

My reconstruction of this structure is given below:
struct stored_packet_data
{
  _DWORD source_addr;
  _DWORD dst_addr;
  _WORD source_port;
  _BYTE *data_buf_ptr;
  _WORD data_len;
};
Decompiled and cleaned code of the receiving function is available here.
The receiving function does nothing but the initial checks of the data, and the filling of this structure. But there is another function, running in a separate thread, that reads this filled buffer and verifies it further.

We can see that the first value of the data buffer must be either 1, 2, or 3, and other (>3), and it will be used as a command to be executed:

We can further see some CRC32 calculating function, and some decrypting. So, this must be the valid function to analyze in order to obtain the flag.
The decompiled code of the thread processing the buffer is available here.
Patching out the defensive checks
At this point I decided that it will be the most convenient to follow the flow by dynamic analysis. But as we saw, the crackme is loaded with various defensive checks that doesn’t let it run under the debugger. So, in order to continue, they must be patched out.
Earlier I already patched out one and antidebug check: it required nothing but removing a single conditional jump. But to remove the rest of them will be much more difficult.
First, the checks are initialized.

The same function is responsible for patching NTDLL:
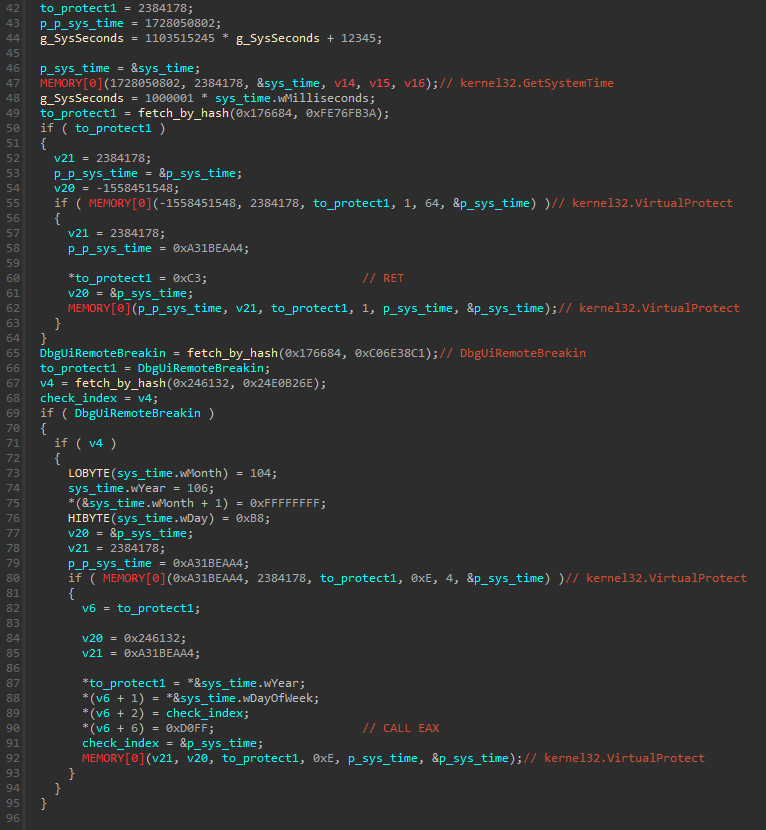
Functions responsible for various defensive checks are added into the map:

Only one of those checks will be deployed: it is selected randomly, basing on the current time. This explains non-deterministic behavior during the tracing.
Unfortunately, we cannot simply NOP the call to this function, because that would cause crashes later. The map of the checks is used in multiple places, and it cannot be empty.
So, instead of trying to remove it, I decided to neutralize it in a less invasive way. As we saw, there are various functions with checks added to the map, with various IDs. Those functions vary in the complexity. The simplest of them seemed to be the one that just calls CheckRemoteDebuggerPresent, and causes application to exit if the debugger was detected.

check_remote_debug – original versionI made a patch inside this function, just to blind the check (changed the conditional jump into unconditional):

Then I modified the mapping, so that the above function will be the only one added to the map, at every possible index:

By this way we still have the checks running, but in a way that is not disturbing. The crackme can be run under the debugger with no problems.
Patching the IPv4 flag
As we saw during static analysis, the crackme proceeds with the received buffer only if the IPv4 reserved flag is set. The problem is, it is not a standard situation. When se send the packet by nping, the reserved flag will be clear.
Rather than trying to somehow enforce passing this flag, I decided to simply do the patch in the code, to avoid it being checked.

Analysis of the verification function
Finally we are ready for the dynamic analysis of the verification function.
I decided to make some experiments by sending the buffer with one of the expected commands with the help of nping, and then watch under the debugger how it is processed.
Command #1
Commandline:
nping --udp -p 4356 --dest-ip 127.0.0.1 -c 1 --data 01000000
The command 1 causes a fake flag to be decrypted:

Yet another artifact that gets decrypted on this command is a BMP, that is a frame from the famous “Rick roll” video clip. Interestingly, this frame is being displayed on the console.

We can easily conclude, that this command serves no other purpose than being a red herring.
Command #2
At first, sending the buffer with this command was causing an application to crash. After taking a closer look, I realized that the DWORD defining the command must be followed by another DWORD : this time defining the size of the buffer that comes after that. When we send a buffer in a valid format, it is being copied, and then compared with three keywords, that are dynamically decrypted:
"L0ve", "s3cret", "5Ex", "g0d"

If the comparison passes, the crc32 of the buffer is being calculated, and stored in another buffer. Initially I dismissed those strings, thinking they are yet another red herring, but they turned out to be very important…
Command #3
This command expects two additional arguments (DWORDs). The first one must be 3, and the second: MZ.

nping --udp -p 4356 --dest-ip 127.0.0.1 -c 1 --data 03000000020000004d5a0000
After we send the buffer in the expected format, something new will be decrypted with the help of RC4 algorithm (using WinAPI, and the patched version of the function CryptImportKey). I expected it to be the flag…
Obtaining the flag
Initially, when I tried to send the command 3, it was reaching the RC4 decryption part, but the buffer used as the RC4 key was empty. At first I thought that maybe I destroyed something because of my patching, so I asked for a hint if this is really the way as this part of the crackme should look like. Fortunately, it turned out that everything is fine, I just should take a closer look what other command can fill this key.
After some more experiments it became clear that the CRC32 checksums from the command #2 are going to be filled into the key buffer.
So, all what was needed at this point was to send those buffers one by one, in a properly formated packets:
02000000 05000000 4C 30 76 65 00 -> L0ve
02000000 07000000 73 33 63 72 65 74 00 -> s3cret
02000000 04000000 35 45 78 00 -> 5Ex
02000000 04000000 67 30 64 00 -> g0d
Commands:
dnping --udp -p 4356 --dest-ip 127.0.0.1 -c 1 --data 02000000050000004C30766500
nping --udp -p 4356 --dest-ip 127.0.0.1 -c 1 --data 020000000700000073336372657400
nping --udp -p 4356 --dest-ip 127.0.0.1 -c 1 --data 020000000400000035457800
nping --udp -p 4356 --dest-ip 127.0.0.1 -c 1 --data 020000000400000067306400
This causes filling full RC4 key.
Then we need to send the command 3:
nping --udp -p 4356 --dest-ip 127.0.0.1 -c 1 --data 03000000020000004d5a0000
This will trigger the decryption of the flag.

Finally, the flag got decrypted!
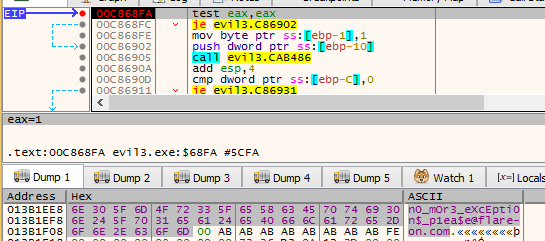
Flag:
[email protected]
如有侵权请联系:admin#unsafe.sh