New releaseSep 21, 2026Real-time network diagnostics in your terminal. One command, zero config, ins 2026-9-21 02:36:13 Author: kitploit.com(查看原文) 阅读量:4 收藏
New releaseSep 21, 2026
Real-time network diagnostics in your terminal. One command, zero config, instant visibility.
Network diagnostics in your terminal.






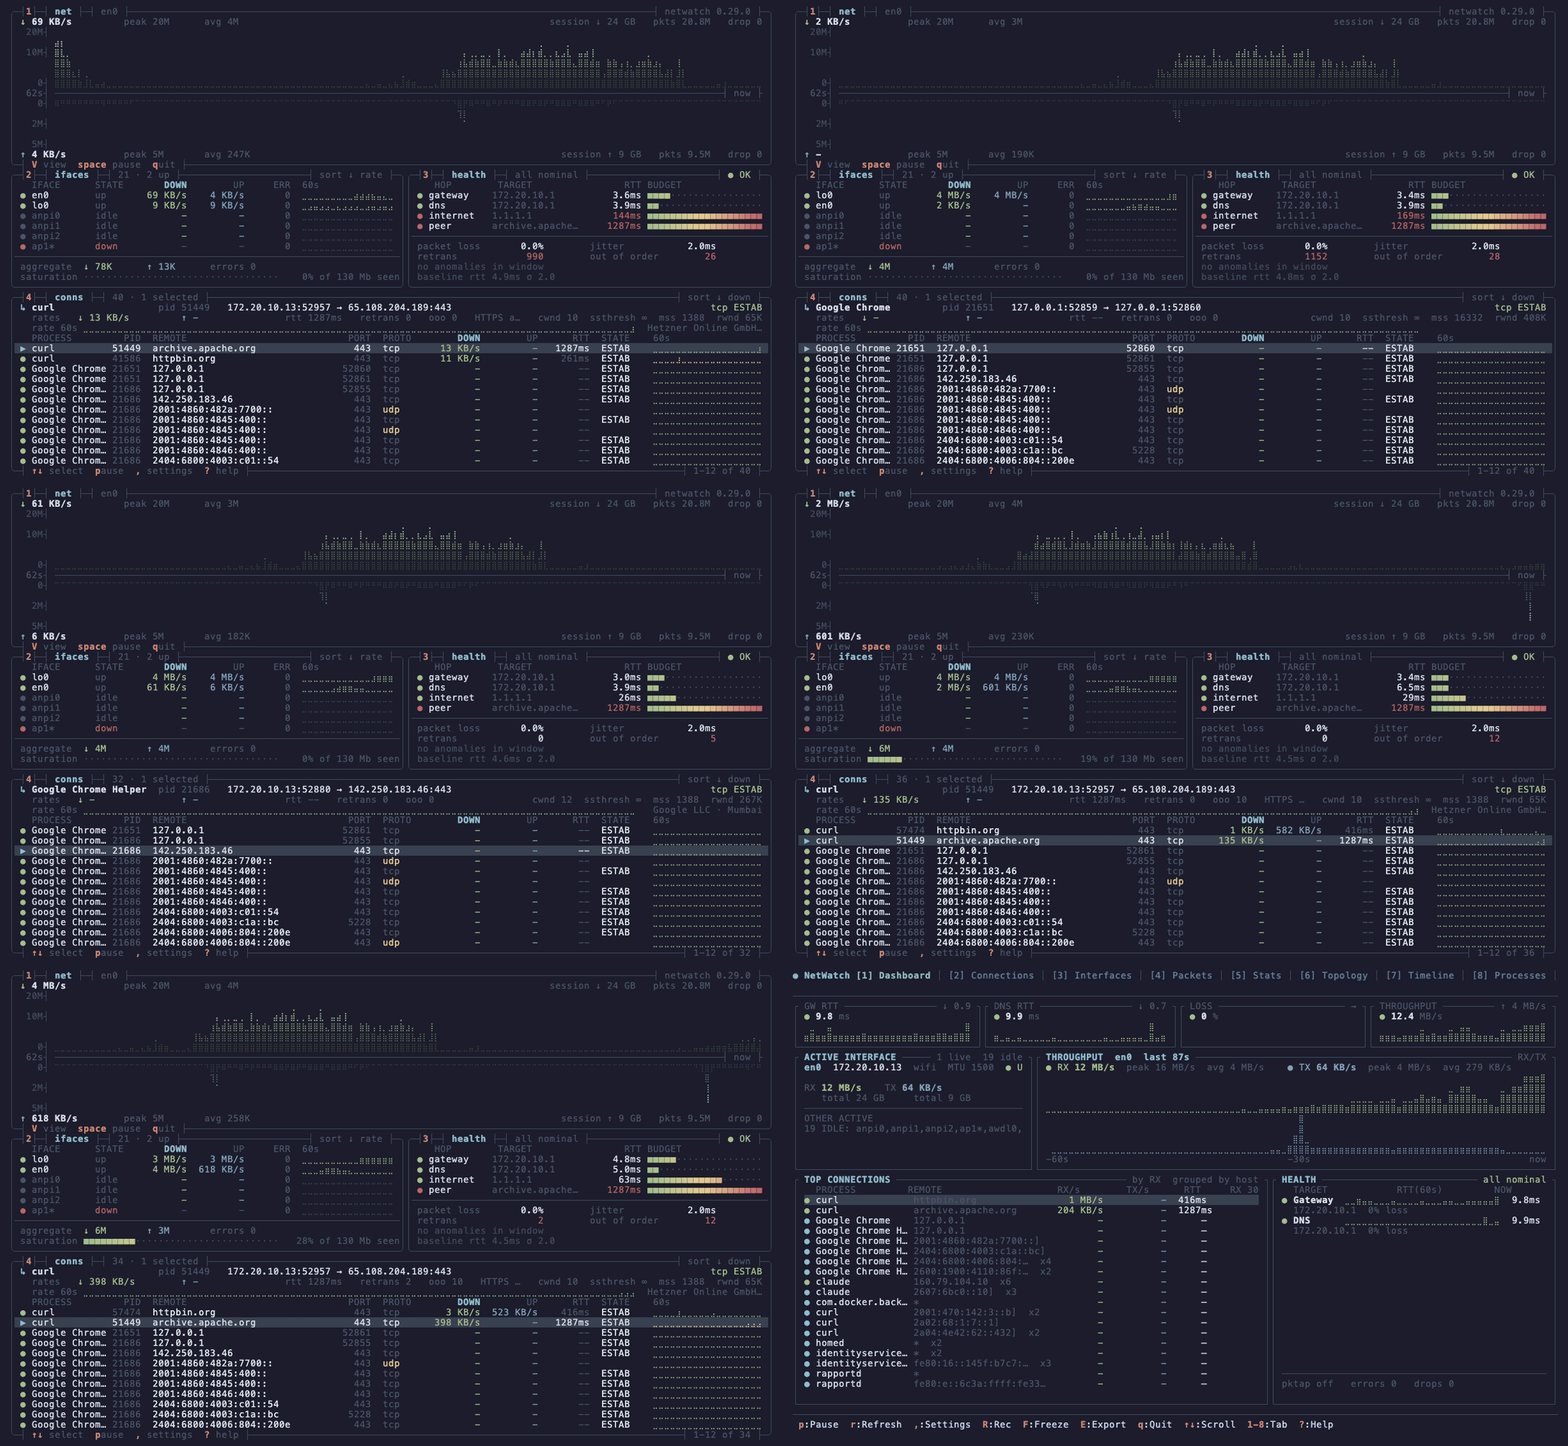
netwatch --view dense. Four boxes, no chrome, every keybind on a border. Download grows up from the axis, upload grows down.
One binary, no config. sudo netwatch and you have live capture with L7 decode, process attribution where available, and a diagnostic engine that opens an issue when a learned baseline breaks and closes it when the fix holds.
Install
brew install netwatch                 # macOS / Linux
scoop install netwatch                # Windows (needs Npcap)
cargo binstall netwatch-tui           # prebuilt binary, anywhere with Rust
paru -S netwatch-tui                  # Arch (AUR)
nix-shell -p netwatch                 # NixOS / Nix
Debian / Ubuntu (apt repository):
curl -fsSL https://matthart1983.github.io/netwatch/apt/netwatch.gpg \
  | sudo tee /usr/share/keyrings/netwatch.gpg >/dev/null
echo "deb [signed-by=/usr/share/keyrings/netwatch.gpg] \
https://matthart1983.github.io/netwatch/apt stable main" \
  | sudo tee /etc/apt/sources.list.d/netwatch.list
sudo apt update && sudo apt install netwatch
Fedora: sudo dnf copr enable matthart1983/netwatch && sudo dnf install netwatch
Container: docker run --rm -it --net=host --pid=host --cap-add=NET_RAW ghcr.io/matthart1983/netwatch
Binaries for macOS, Linux (x86_64, aarch64, armv5te) and Windows are on the
releases page, with
.deb, .rpm, checksums and signed provenance. The Linux builds are static and
need nothing installed; Windows needs Npcap.
Verifying a download ·
every channel.
Run
netwatch              # interfaces, connections, config. No privileges.
sudo netwatch         # enables capture where elevated access is required
netwatch --lite       # one 80x24 screen
netwatch --view dense # four boxes, 130x44 or larger
1 to 9 and 0 switch tabs, V cycles the three views, ? shows every key. To run without sudo on Linux, grant the capabilities once: sudo setcap 'cap_net_raw,cap_bpf,cap_perfmon+eip' "$(which netwatch)" (why and when to repeat it).
The tabs
| # | Tab | Shows |
|---|---|---|
| 1 | Dashboard | Latency tiles, mirrored throughput, the link carrying it, connections rolled up per process |
| 2 | Connections | Every socket with process, PID, state, GeoIP, RTT, retransmits |
| 3 | Interfaces | Addresses, MTU, rates, errors, drops |
| 4 | Packets | Live decode, TLS 1.3 decryption, JA4, stream tracking, display filters, PCAP export |
| 5 | Stats | Protocol breakdown and handshake-timing histogram |
| 6 | Topology | Machine, gateway, DNS, top hosts, traceroute |
| 7 | Timeline | Connections by TCP state, with alerts |
| 8 | Processes | Bandwidth per process |
| 9 | Diagnose | Issue, cause, fix, verified close. report.md from the same objects |
| 0 | Egress | Learned destinations, promoted policy, drift |
Every keybinding, display filters, decoders, themes, configuration.
Views
V cycles all three without a restart; the collectors keep running.
| View | Size | For |
|---|---|---|
| Full | any | The ten tabs above |
Lite (--lite) | 80x24 | An SSH session to a Pi, or a tmux split |
Dense (--view dense) | 130x44+ | The hero image: four boxes, braille throughput, kernel TCP detail |
Docs
| Reference | Keys, filters, decoders, configuration, permissions |
| Diagnose | Baselines, the 30 rules, ranked causes, verified closes |
| TLS decryption | Point SSLKEYLOGFILE at netwatch and read your own traffic |
| Egress linting | Observe destinations, promote a policy, alert on what you block |
| Security and forensics | Beaconing, scans, DNS tunnelling, JA4, the flight recorder |
| Capability matrix | Platform differences, diagnostic limits and verification scope |
| Attribution evidence | Identity, freshness, coverage denominators and controlled results |
| Doctor command | Read-only setup report, JSON capabilities and optional capture check |
| Design 0.30 | Why the screens look the way they do |
| Architecture | Runtime, source map, permissions model, how to build and verify |
| AI Insights | Optional LLM commentary inside Diagnose, off by default |
| Prometheus export | Exposed metrics and scrape config |
| Packaging | Every channel, and what updates it |
| Changelog | Every release |
SysWatch and DiskWatch share the chrome. ESSH is a Rust SSH client with the same look. NetWatch Cloud is hosted fleet monitoring built on the MIT agent, SDK and dashboard.
Thanks
Much of the packaging is other people's work. Dominiquini and kemelzaidan maintain netwatch-tui and netwatch-tui-bin on the AUR, tomasrivera the nixpkgs package, scillidan the Scoop entry, and the Homebrew maintainers took the formula into core. File packaging problems with them and netwatch bugs here.
@lamchau, @fdncred and @PeteE sent patches. Everyone who opened an issue with a repro or argued with a design decision is the reason the output is right on more terminals than mine.
Contributing
Discussions, issues, CONTRIBUTING.md.
License
MIT
Categories
如有侵权请联系:admin#unsafe.sh