An investigation into intermittent gateway failures, NGINX worker restarts, and the metrics that exp 2026-9-16 09:49:15 Author: hackernoon.com(查看原文) 阅读量:6 收藏
An investigation into intermittent gateway failures, NGINX worker restarts, and the metrics that exposed the pattern
An API gateway failure does not always begin with an unavailable upstream service. Sometimes the gateway itself loses the ability to select a target, and the resulting error makes the upstream look guilty.
We use Kong Gateway as part of our product.
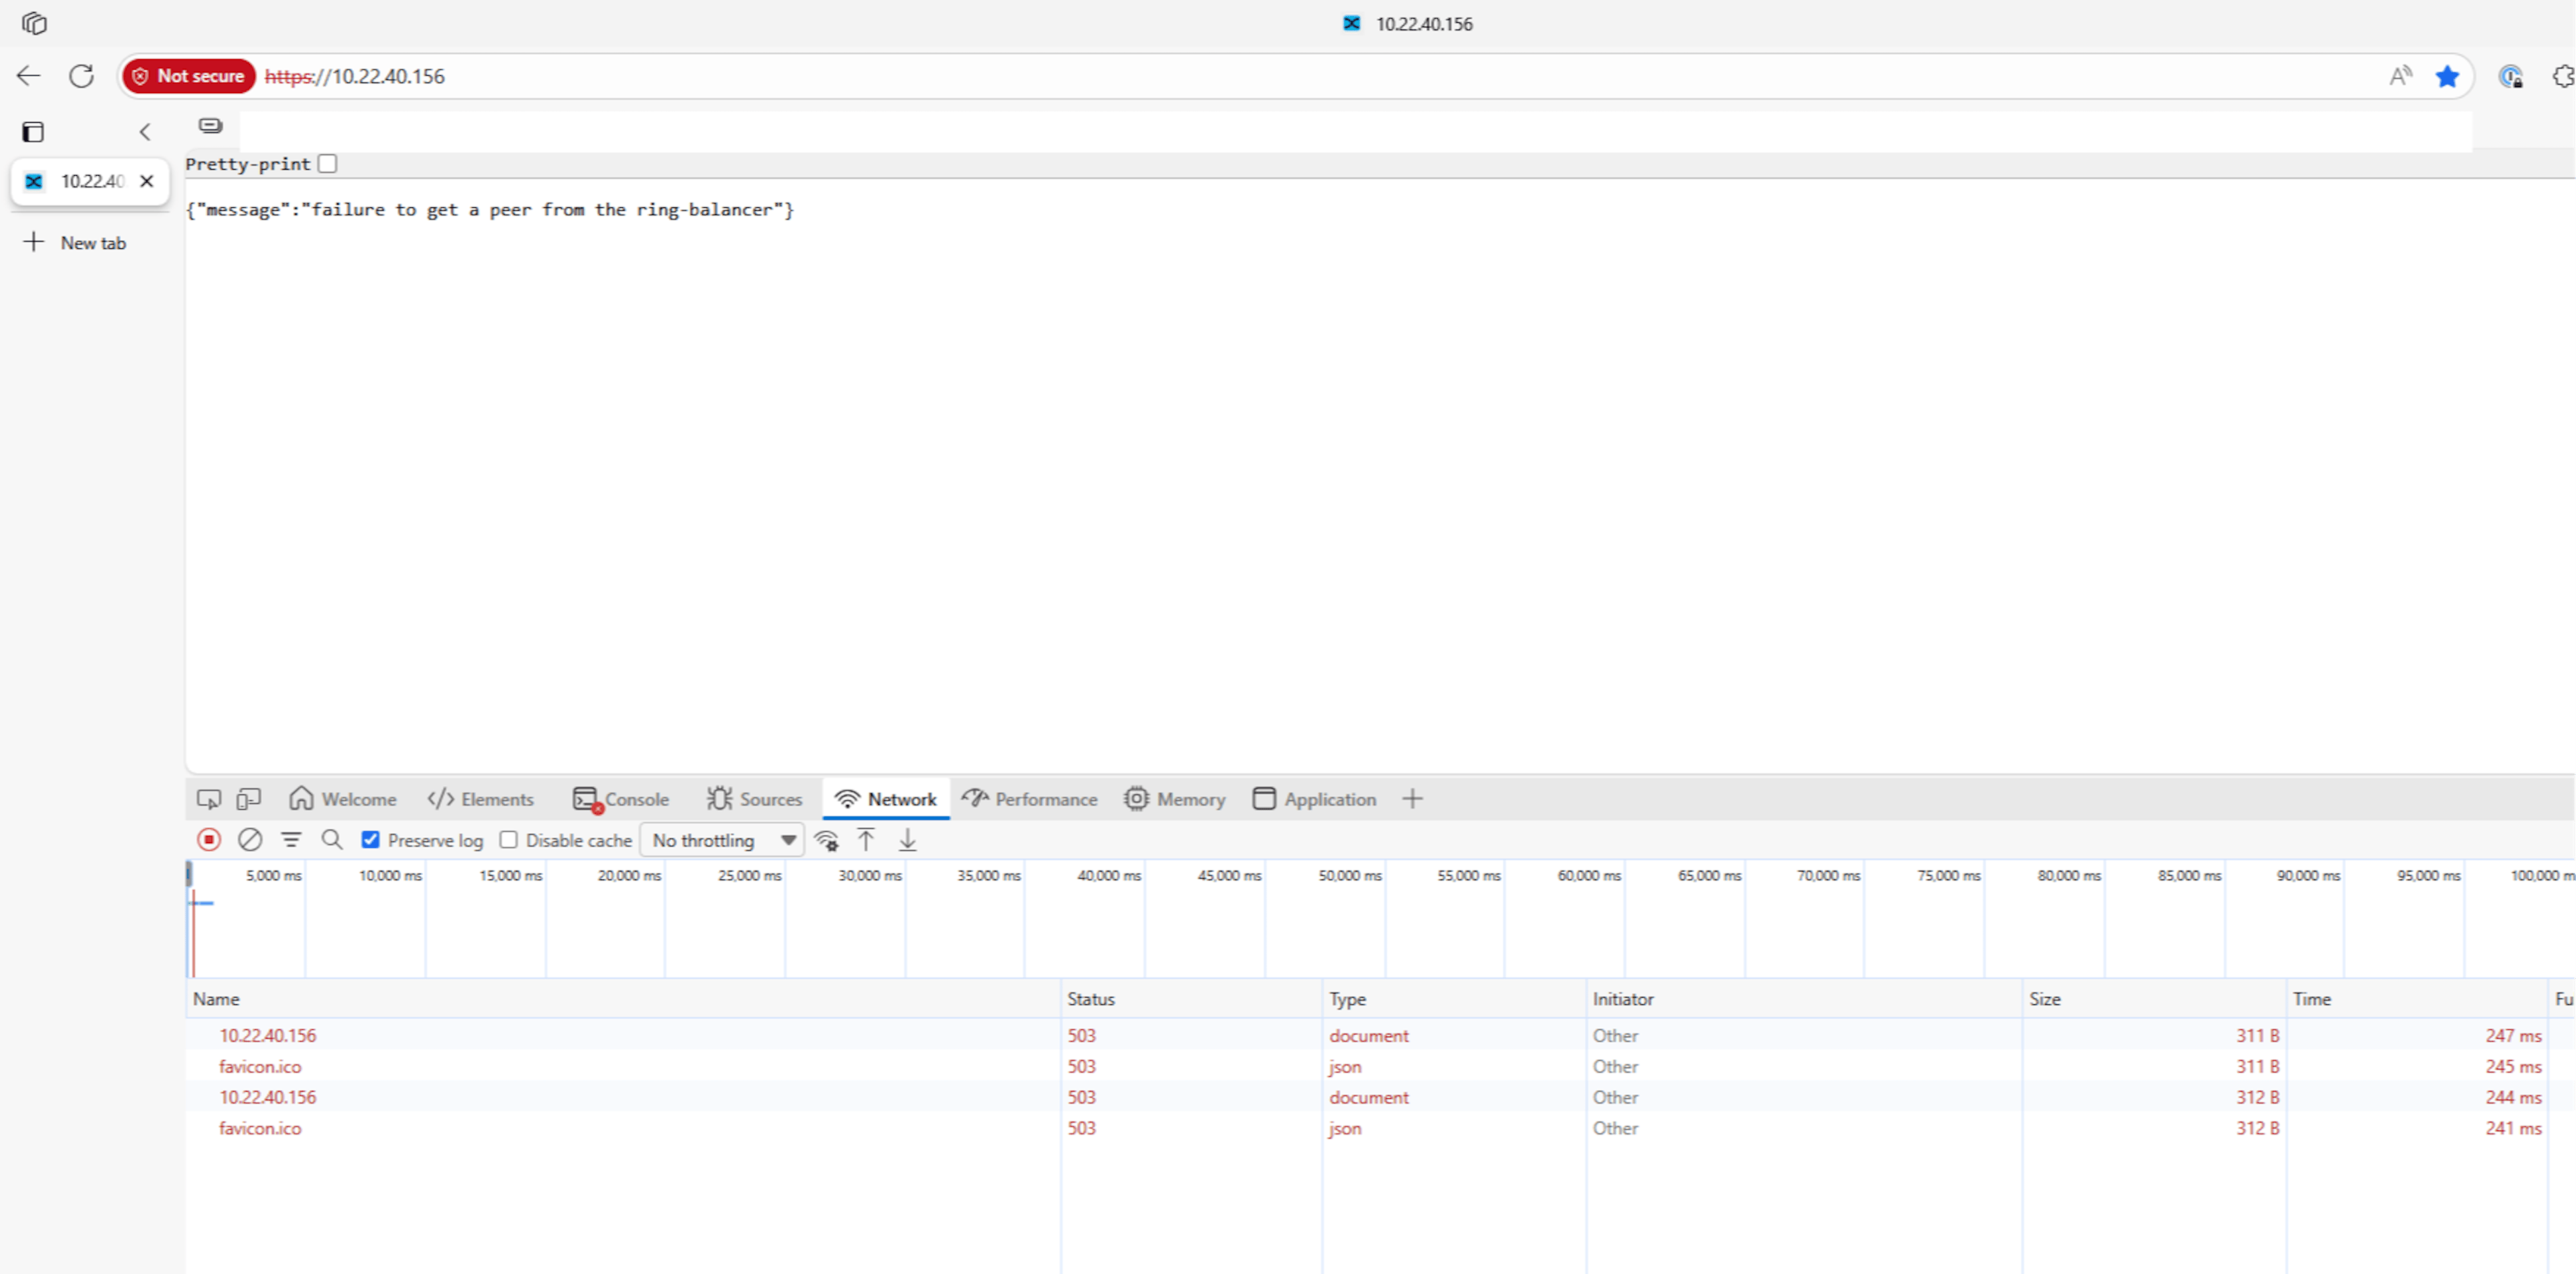
Occasionally, users opening the UI received an HTTP 503 response:
failure to get a peer from the ring-balancer
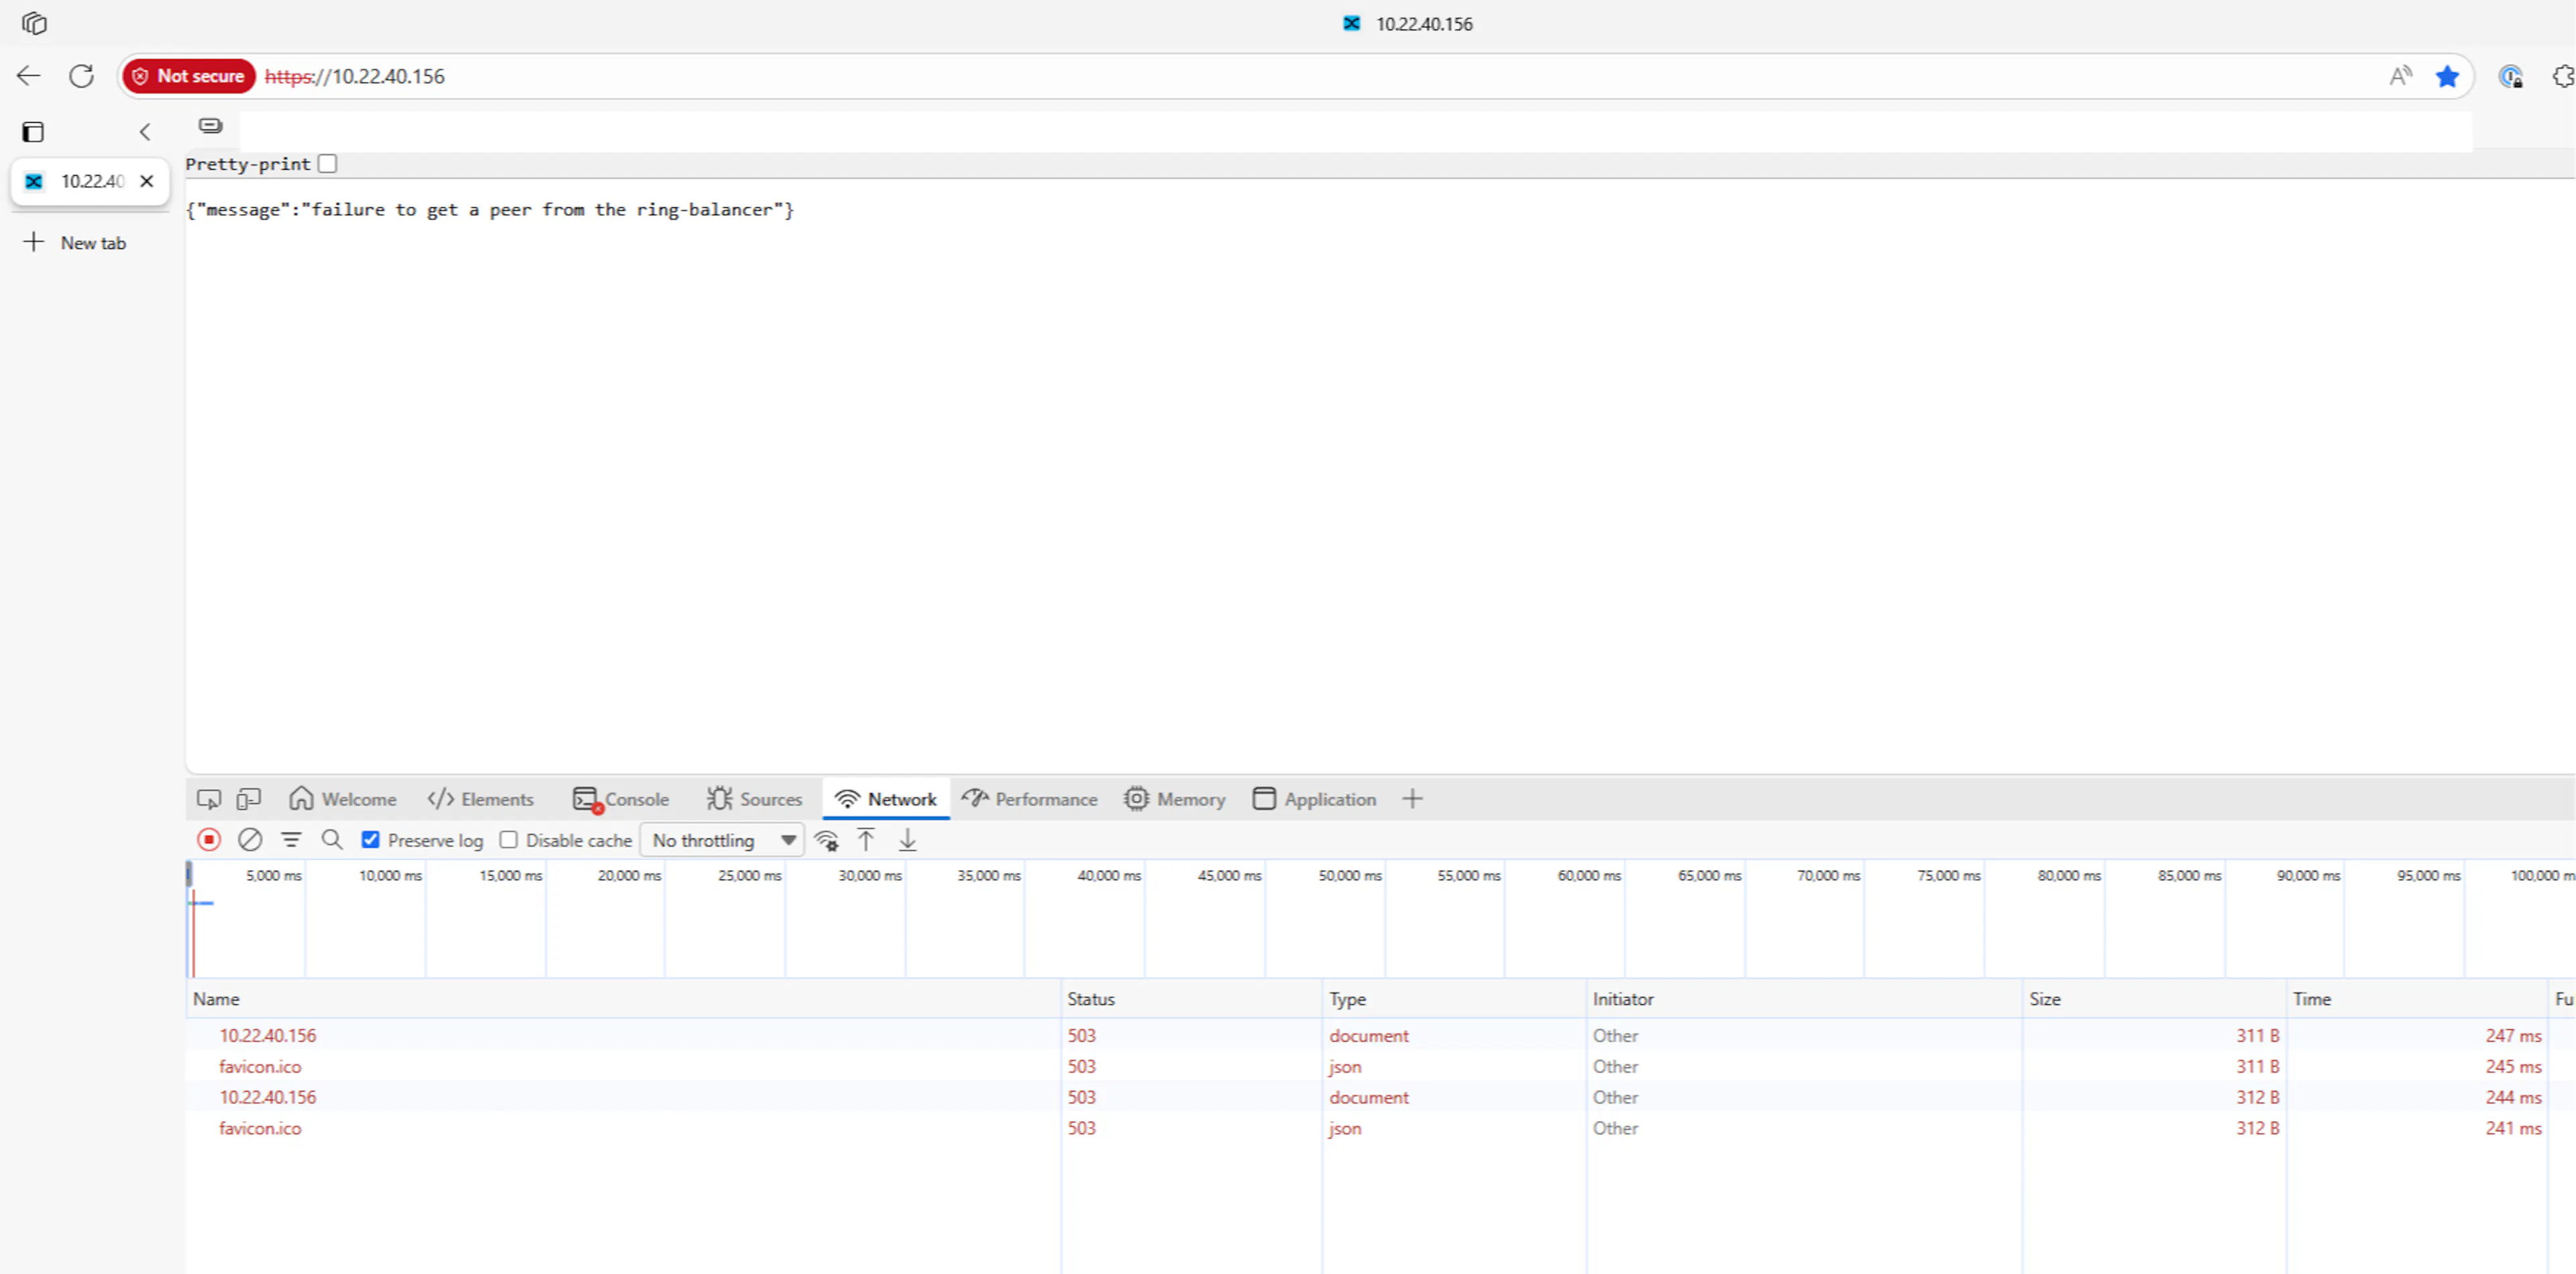
The message was brief, intermittent, and easy to misread. On the server side, we did not see a matching Kong error entry; the request log showed only the 503 status. We also found no issues with the upstream services or Kubernetes DNS lookups.
The more useful clue was the timing around NGINX worker restarts inside Kong. Correlating request status, system logs, and Kong’s worker Lua VM memory metric helped us move from “the UI is sometimes broken” to a concrete operational hypothesis.
What the ring balancer is doing
Kong’s request path is roughly like this:
client → Route → Service → Upstream → ring balancer → Target
The ring balancer is responsible for choosing a target for the Upstream. Kong can have multiple Targets behind one Upstream, and health-check state determines which of them are eligible to receive traffic.
When Kong cannot get a peer from the ring balancer, the upstream application is not automatically the problem. Kong may not have had a usable Target to select at that moment.
Some ordinary causes include:
- All Targets being marked unhealthy
- Incorrect Target address or port
- DNS or network connectivity problems
- Health check or circuit breaker excluding targets
- Kong worker restarting while it is handling traffic
- Resource pressure or a crash affecting the gateway process
The error points to the peer-selection stage. It does not identify the cause by itself.
Why the failure was intermittent
The failure did not affect every request. A user could refresh the page and get a successful response immediately after seeing the 503.
That behavior made sense once we considered two NGINX worker processes in the Kong pod. If one worker restarts while the other remains available, most traffic can continue normally. Requests arriving during the worker transition or requests assigned to the affected worker may fail while the rest of the pod appears healthy.
This also explains why a simple pod-level health check was not enough. Kong pod could still be running, and other worker could still be serving requests, while a small number of requests failed.
How we diagnosed it
Before treating NGINX worker restart as the root cause, we checked ordinary ring-balancer conditions.
For the affected Upstream, we verified that:
- Upstream existed
- Targets were configured
- Target addresses and ports were correct
- Health checks had not marked every target unhealthy
- Kong pod could resolve and reach the backend
And we didn't see any upstream issues. There was no useful Kong error log for the request. The access log showed a 503 with an empty upstream address.
While checking Kong pod metrics, we observed that Lua VM metrics showed multiple PIDs.
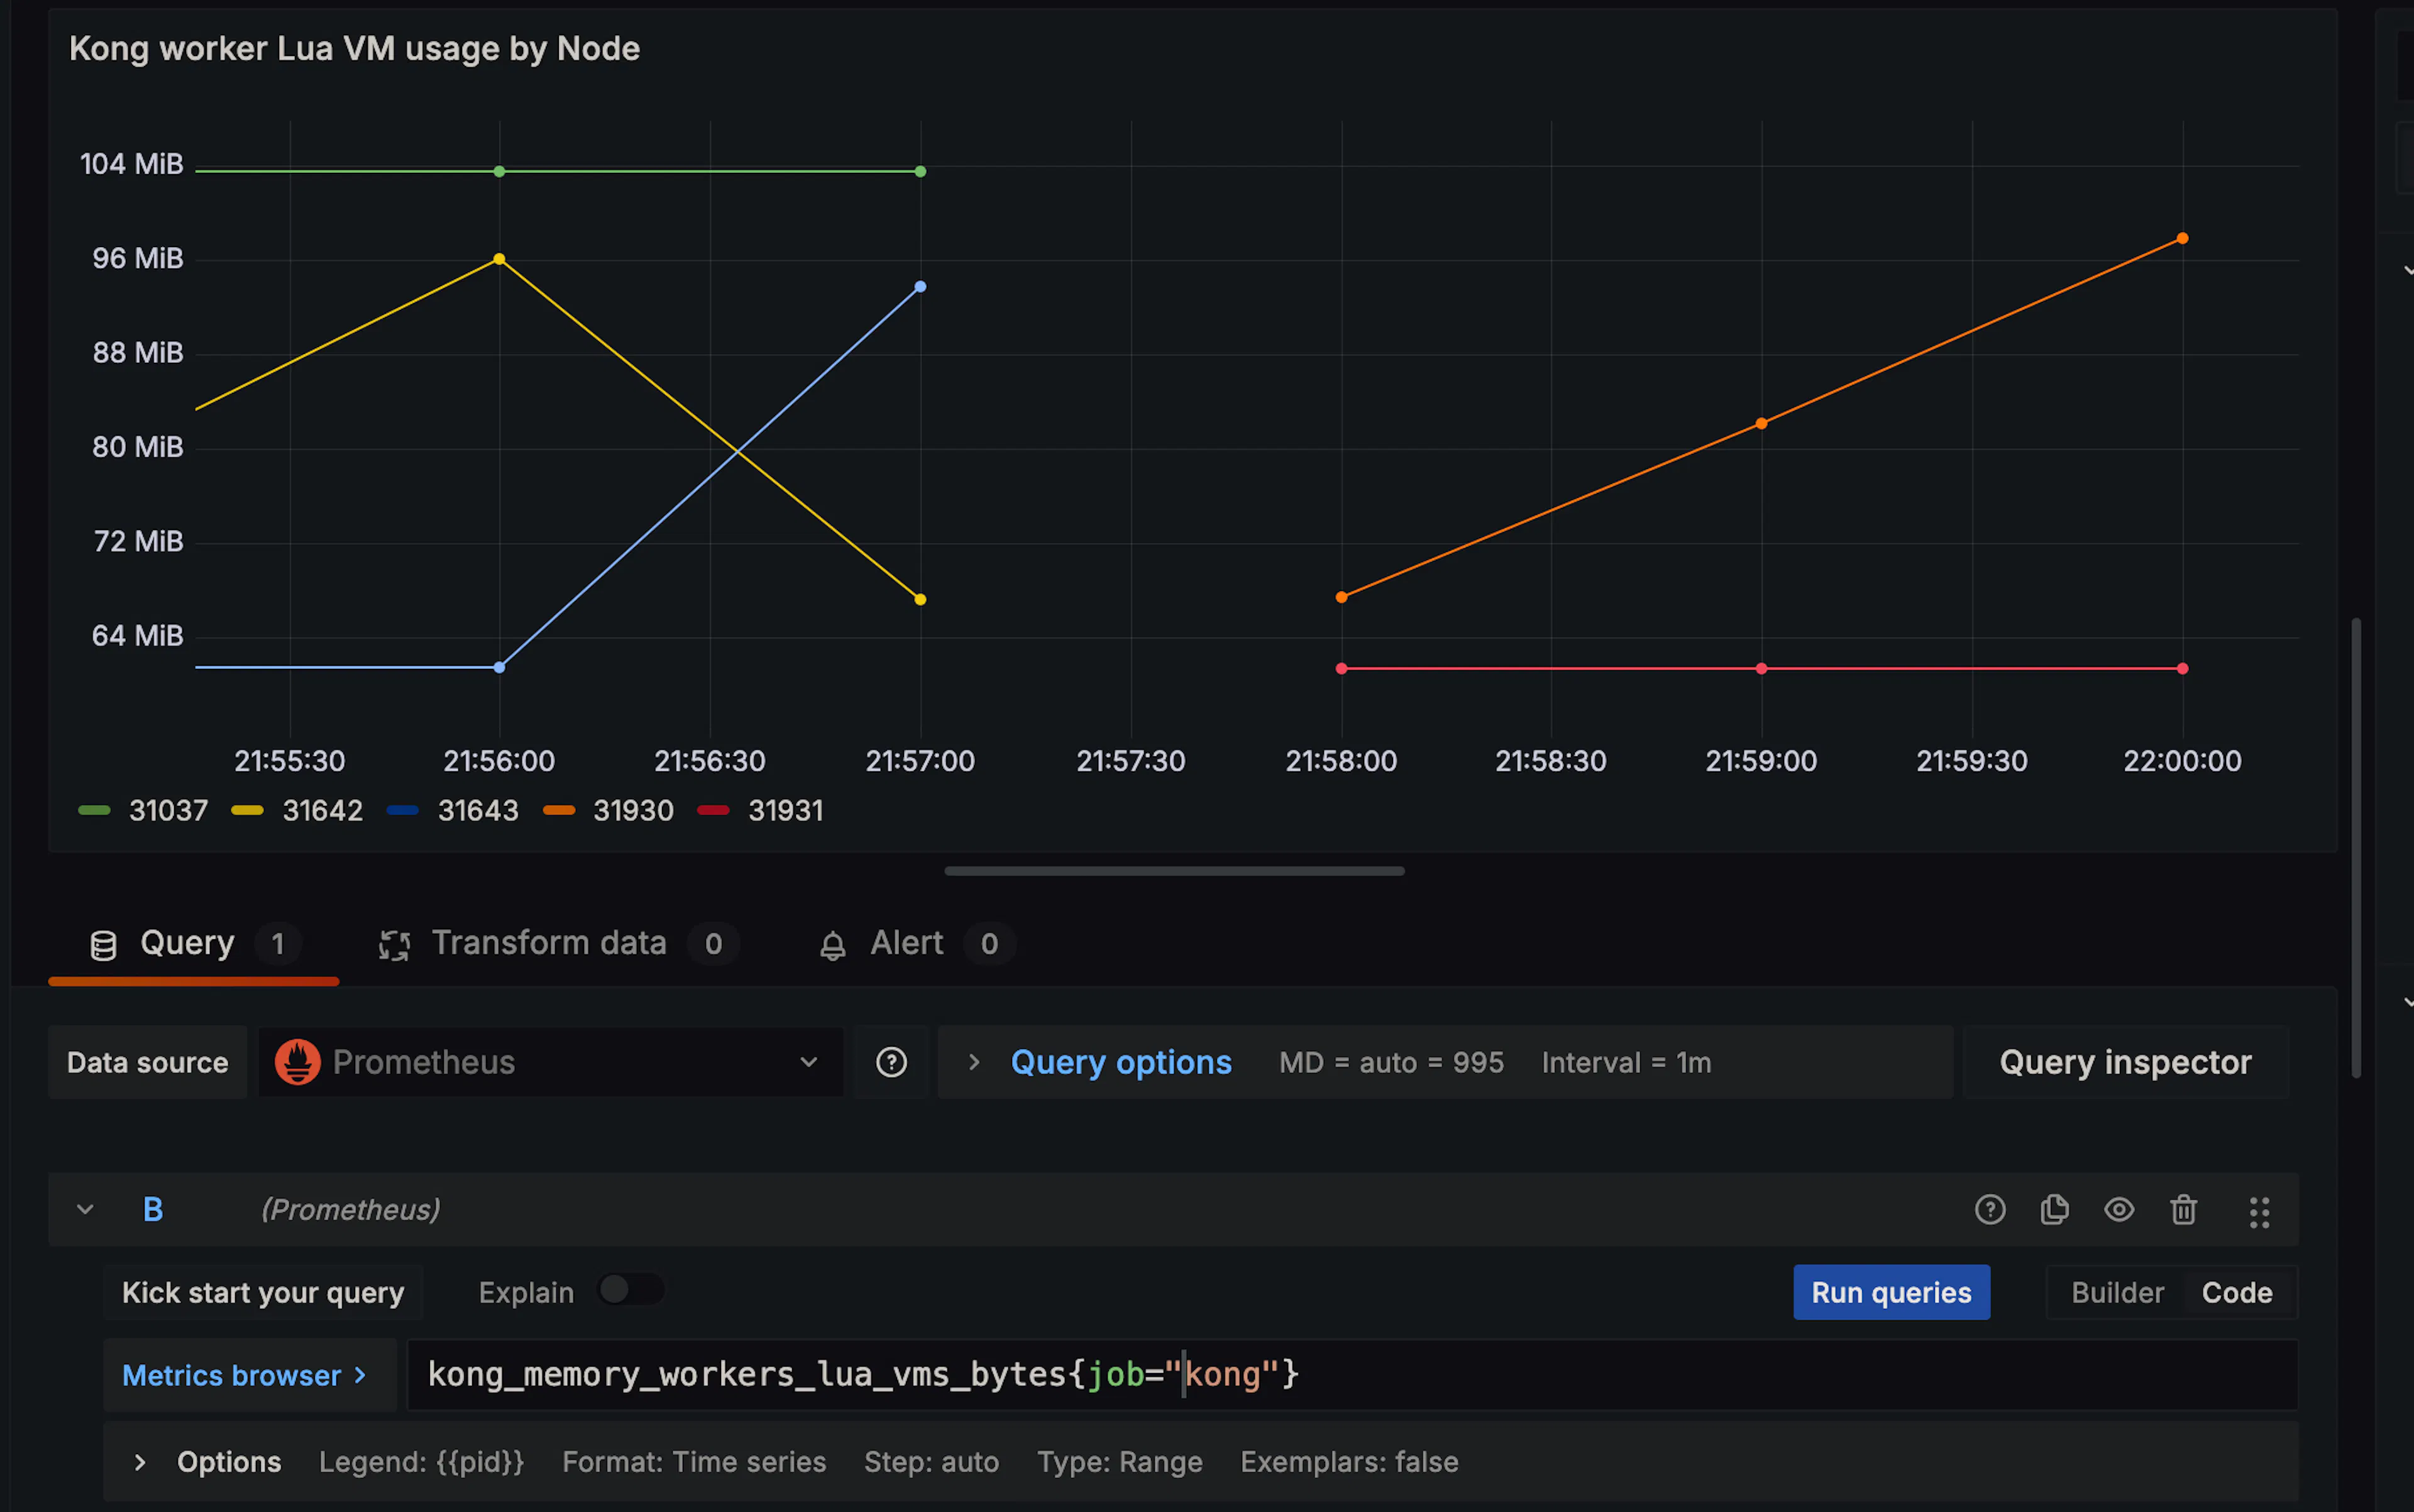
The metrics exposed multiple worker PIDs. Comparing them over time helped us identify worker churn.
The dmesg output then confirmed that the NGINX process had been killed by the pod’s memory cgroup. dmesg log:
[Thu Jul 13 21:57:23] Memory cgroup out of memory: Killed process <pid> (nginx) total-vm:1078892kB, anon-rss:410932kB, file-rss:7968kB, shmem-rss:77532kB, UID:1234 pgtables:1104kB oom_score_adj:999
Once we put the signals on one timeline, the investigation became much less speculative:
503 response
   ↓
worker lifecycle event
   ↓
pod/runtime or kernel evidence
   ↓
worker memory and PID comparison
   ↓
Target health and connectivity check
The 503 was the client-visible symptom. NGINX worker restart was the process-level event. The memory metric and `dmesg` output helped us test whether resource pressure was involved. The Target checks made sure we were not blaming the worker for a normal upstream-health failure.
That distinction mattered because there was no single error log that tied everything together for us.
What we changed in our debugging approach
The main lesson was to stop treating the HTTP status code as a root-cause message.
A 503 tells us that the request was not successfully served. It does not tell us whether the failure happened during routing, peer selection, connection establishment, or another gateway stage. Likewise, a quiet error log does not mean there was no internal failure; it may mean that the configured log stream captured only the access result.
For this class of problem, we now want the following information available together:
- Access logs with route, Upstream, status, and request ID
- Worker start, exit, and respawn events
- Pod restart counts and termination reasons
- Node or container OOM evidence
- Worker Lua VM memory by PID
- Upstream Target health transitions
- Connectivity from the Kong pod to the backend
We also avoid treating a high Lua VM memory value as a diagnosis. It is a signal to correlate with traffic, plugins, configured limits, restarts, and kernel evidence.
A compact runbook
When the next intermittent 503 occurs, the investigation can follow this order:
- Record the timestamp, route, Upstream, request ID, and Kong pod
- Check whether the Upstream has at least one healthy and reachable Target
- Check whether either of the two NGINX worker processes exited or respawned
- Check pod, container, kubelet, runtime, and kernel termination evidence
- Compare
kong_memory_workers_lua_vms_bytesby PID with pod memory and restart timing - Classify the event as an upstream-health issue, OOM event, crash, reload, or another runtime problem
The important part is not to jump from “503” directly to “increase memory.” First establish whether the gateway had no healthy peer, whether a worker was restarting, and whether memory pressure was actually involved.
Final takeaway
Our Kong pod had two NGINX worker processes, and the intermittent nature of the 503s made worker-level investigation worthwhile. We did not get a detailed error log for the failed request. We got a status code, a browser-facing ring-balancer message, worker lifecycle clues, and metrics.
Together, those signals gave us a much better way to investigate than looking at the upstream service alone.
When Kong returns a ring-balancer-related 503, check the Targets—but also check the worker that handled the request.
References
如有侵权请联系:admin#unsafe.sh