The monitoring layer that Valkey deserves.BetterDB persists what Valkey throws away - slow 2026-8-21 02:0:15 Author: kitploit.com(查看原文) 阅读量:5 收藏








The monitoring layer that Valkey deserves.
BetterDB persists what Valkey throws away - slowlogs, command patterns, client activity, anomaly signals - so you can debug what happened at 3am, not just what's happening now. Built for Valkey 8.x with native support for COMMANDLOG, CLUSTER SLOT-STATS, and per-thread I/O metrics. Redis 6+ compatible for everything else.
Website | Docker Hub | npm | Documentation | Blog
BetterDB is built by BetterDB Inc., a public benefit company operating under the OCV Open Charter.
Quick Start (Docker)
docker run -d --name betterdb -p 3001:3001 betterdb/monitor:latest
Point your browser to http://localhost:3001. To monitor a specific instance:
docker run -d \
  --name betterdb \
  -p 3001:3001 \
  -e DB_HOST=your-valkey-host \
  -e DB_PORT=6379 \
  -e DB_PASSWORD=your-password \
  betterdb/monitor:latest
Two image variants are published, both multi-arch (linux/amd64, linux/arm64):
| Tag | What it is |
|---|---|
latest, X.Y.Z-no-ai | Default image - every monitoring feature included, without the dependencies for the experimental local-LLM AI Helper |
X.Y.Z | Adds the experimental AI Helper (bring your own Ollama; disabled by default via AI_ENABLED) |
See Docker Production Deployment for persistent storage, custom ports, licensing, and air-gapped setups.
Quick Start (CLI)
Run BetterDB Monitor without Docker:
On first run, an interactive setup wizard guides you through database connection, storage backend (SQLite, PostgreSQL, or in-memory), and server settings. Configuration is saved to ~/.betterdb/config.json.
npm install -g @betterdb/monitor   # global install
betterdb --setup                   # re-run setup wizard
betterdb --port 8080               # override server port
betterdb --db-host 1.2.3.4         # override database host
betterdb --help                    # all options
Requires Node.js >= 20.0.0 and a Valkey or Redis instance to monitor. For SQLite storage, also npm install -g better-sqlite3.
What You Get
See everything, keep everything
- Historical analytics - query slowlogs, command patterns, client activity, and latency across any time range. The data that used to disappear after a log rotation.
- COMMANDLOG support - Valkey 8.1+ exclusive. Large requests and large replies, not just the slow ones.
- MONITOR capture sessions - record real traffic on demand: live tail, filter, replay, export to JSON/CSV, and cross-reference against connection history.
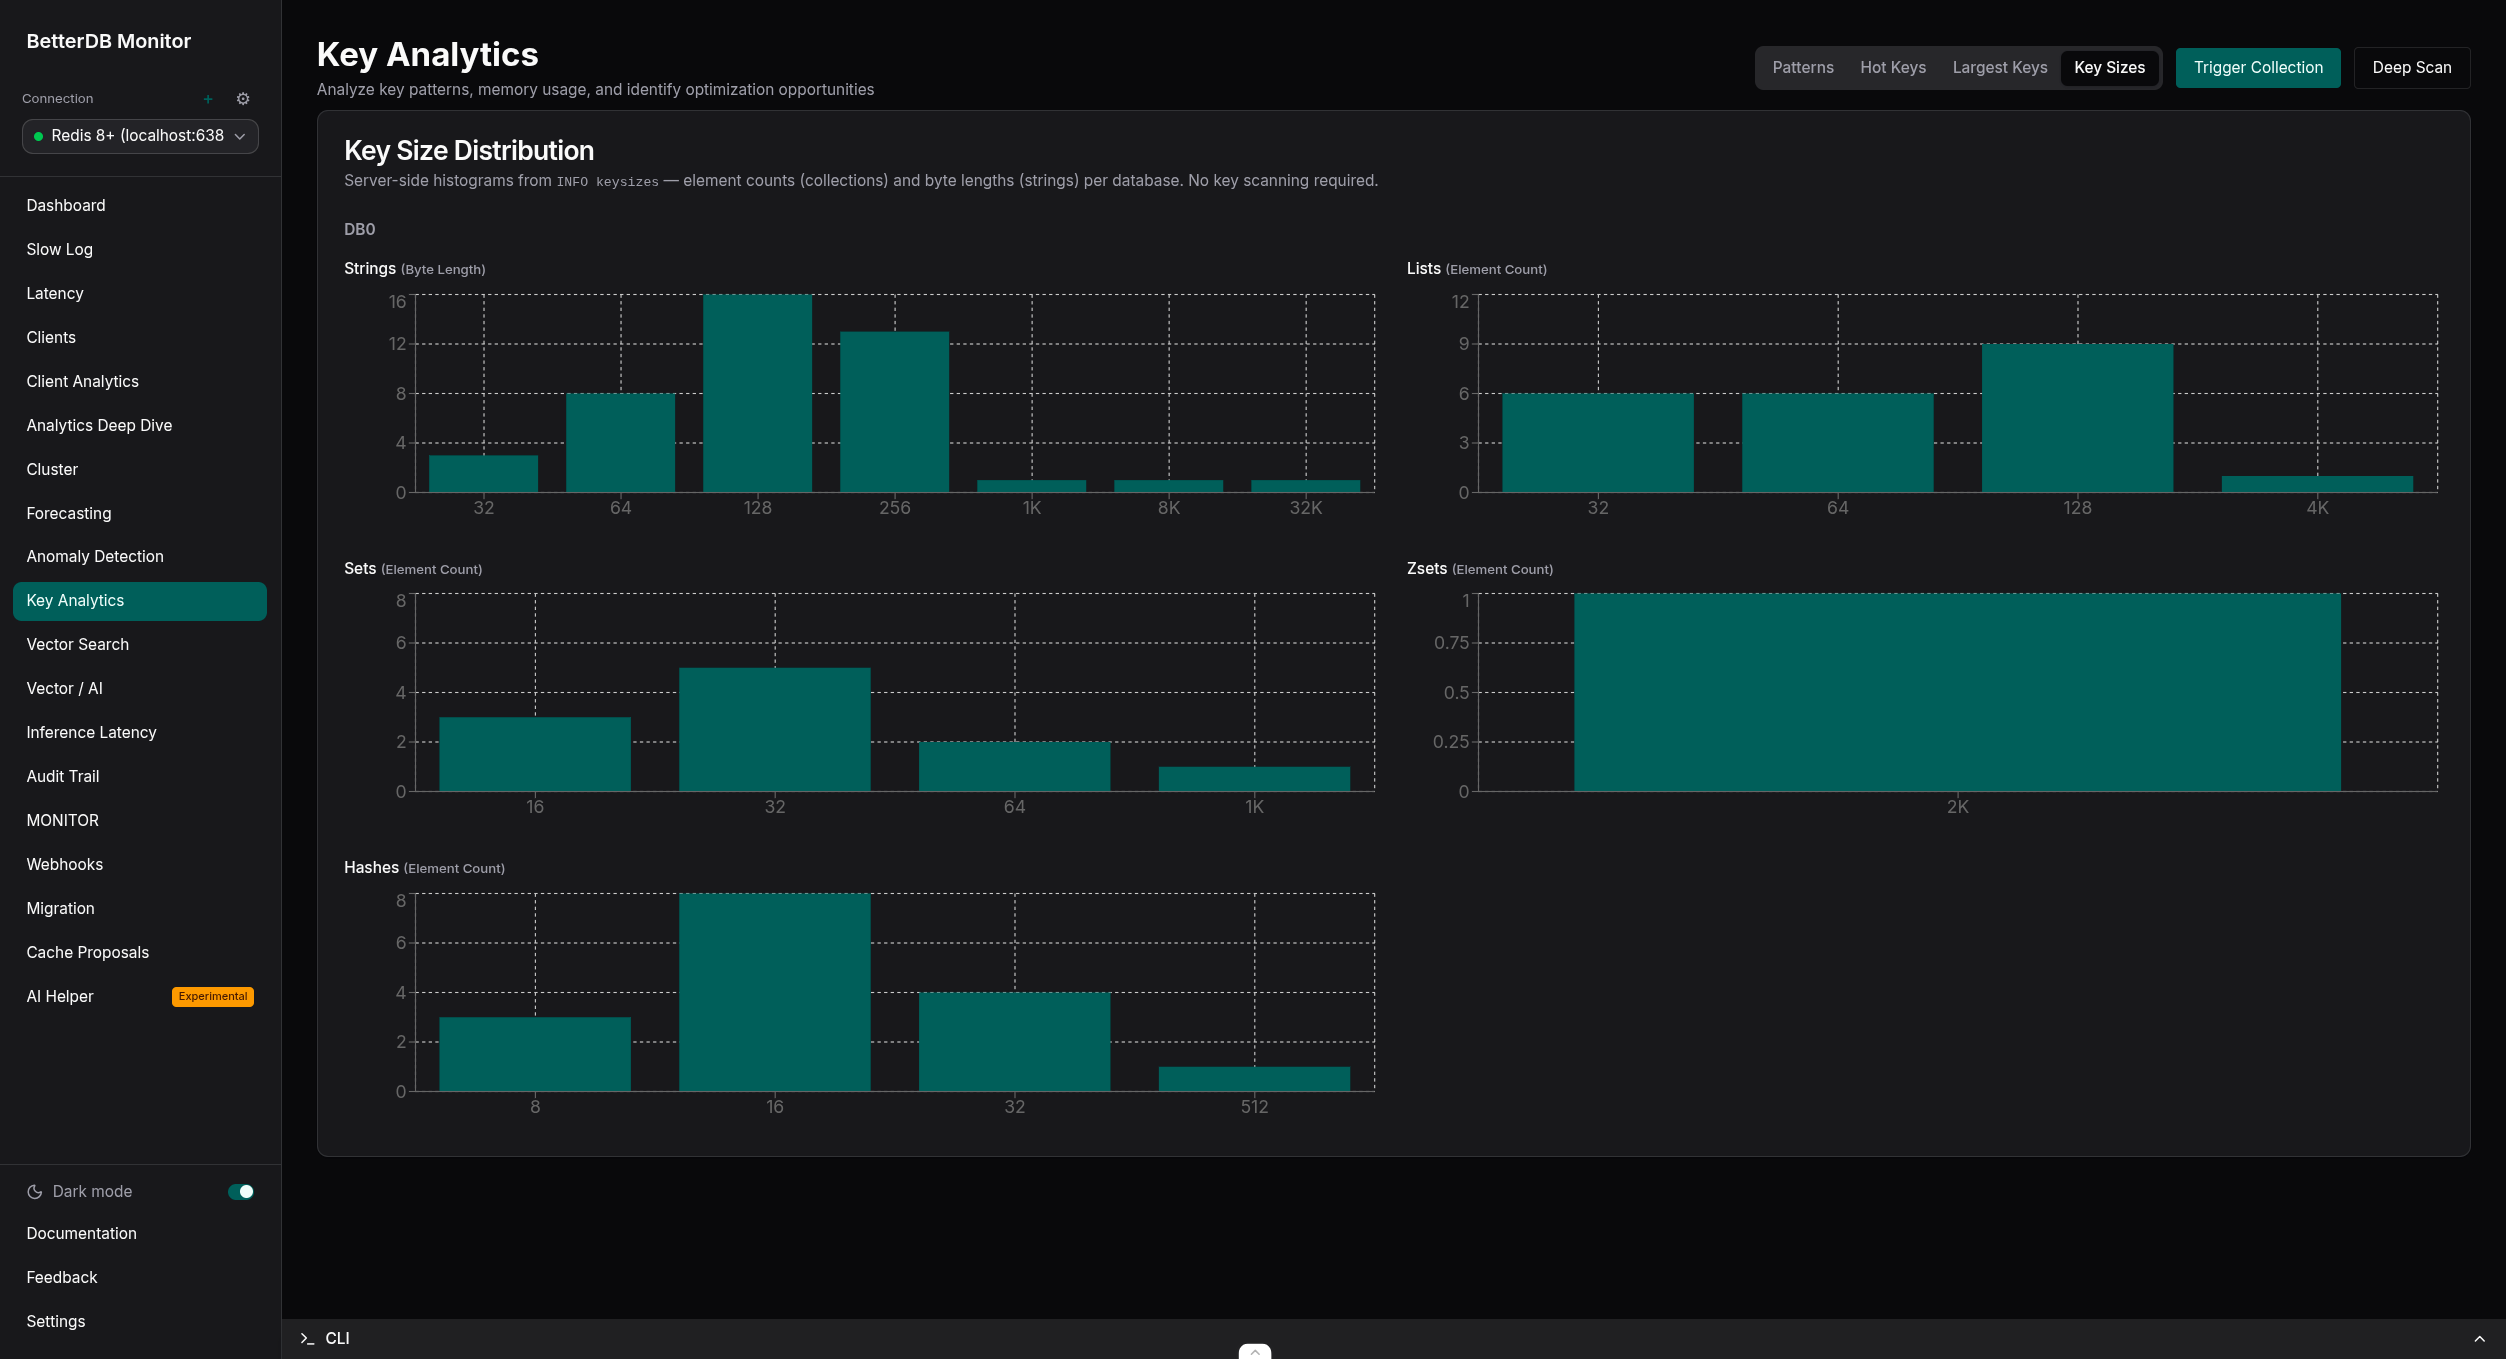
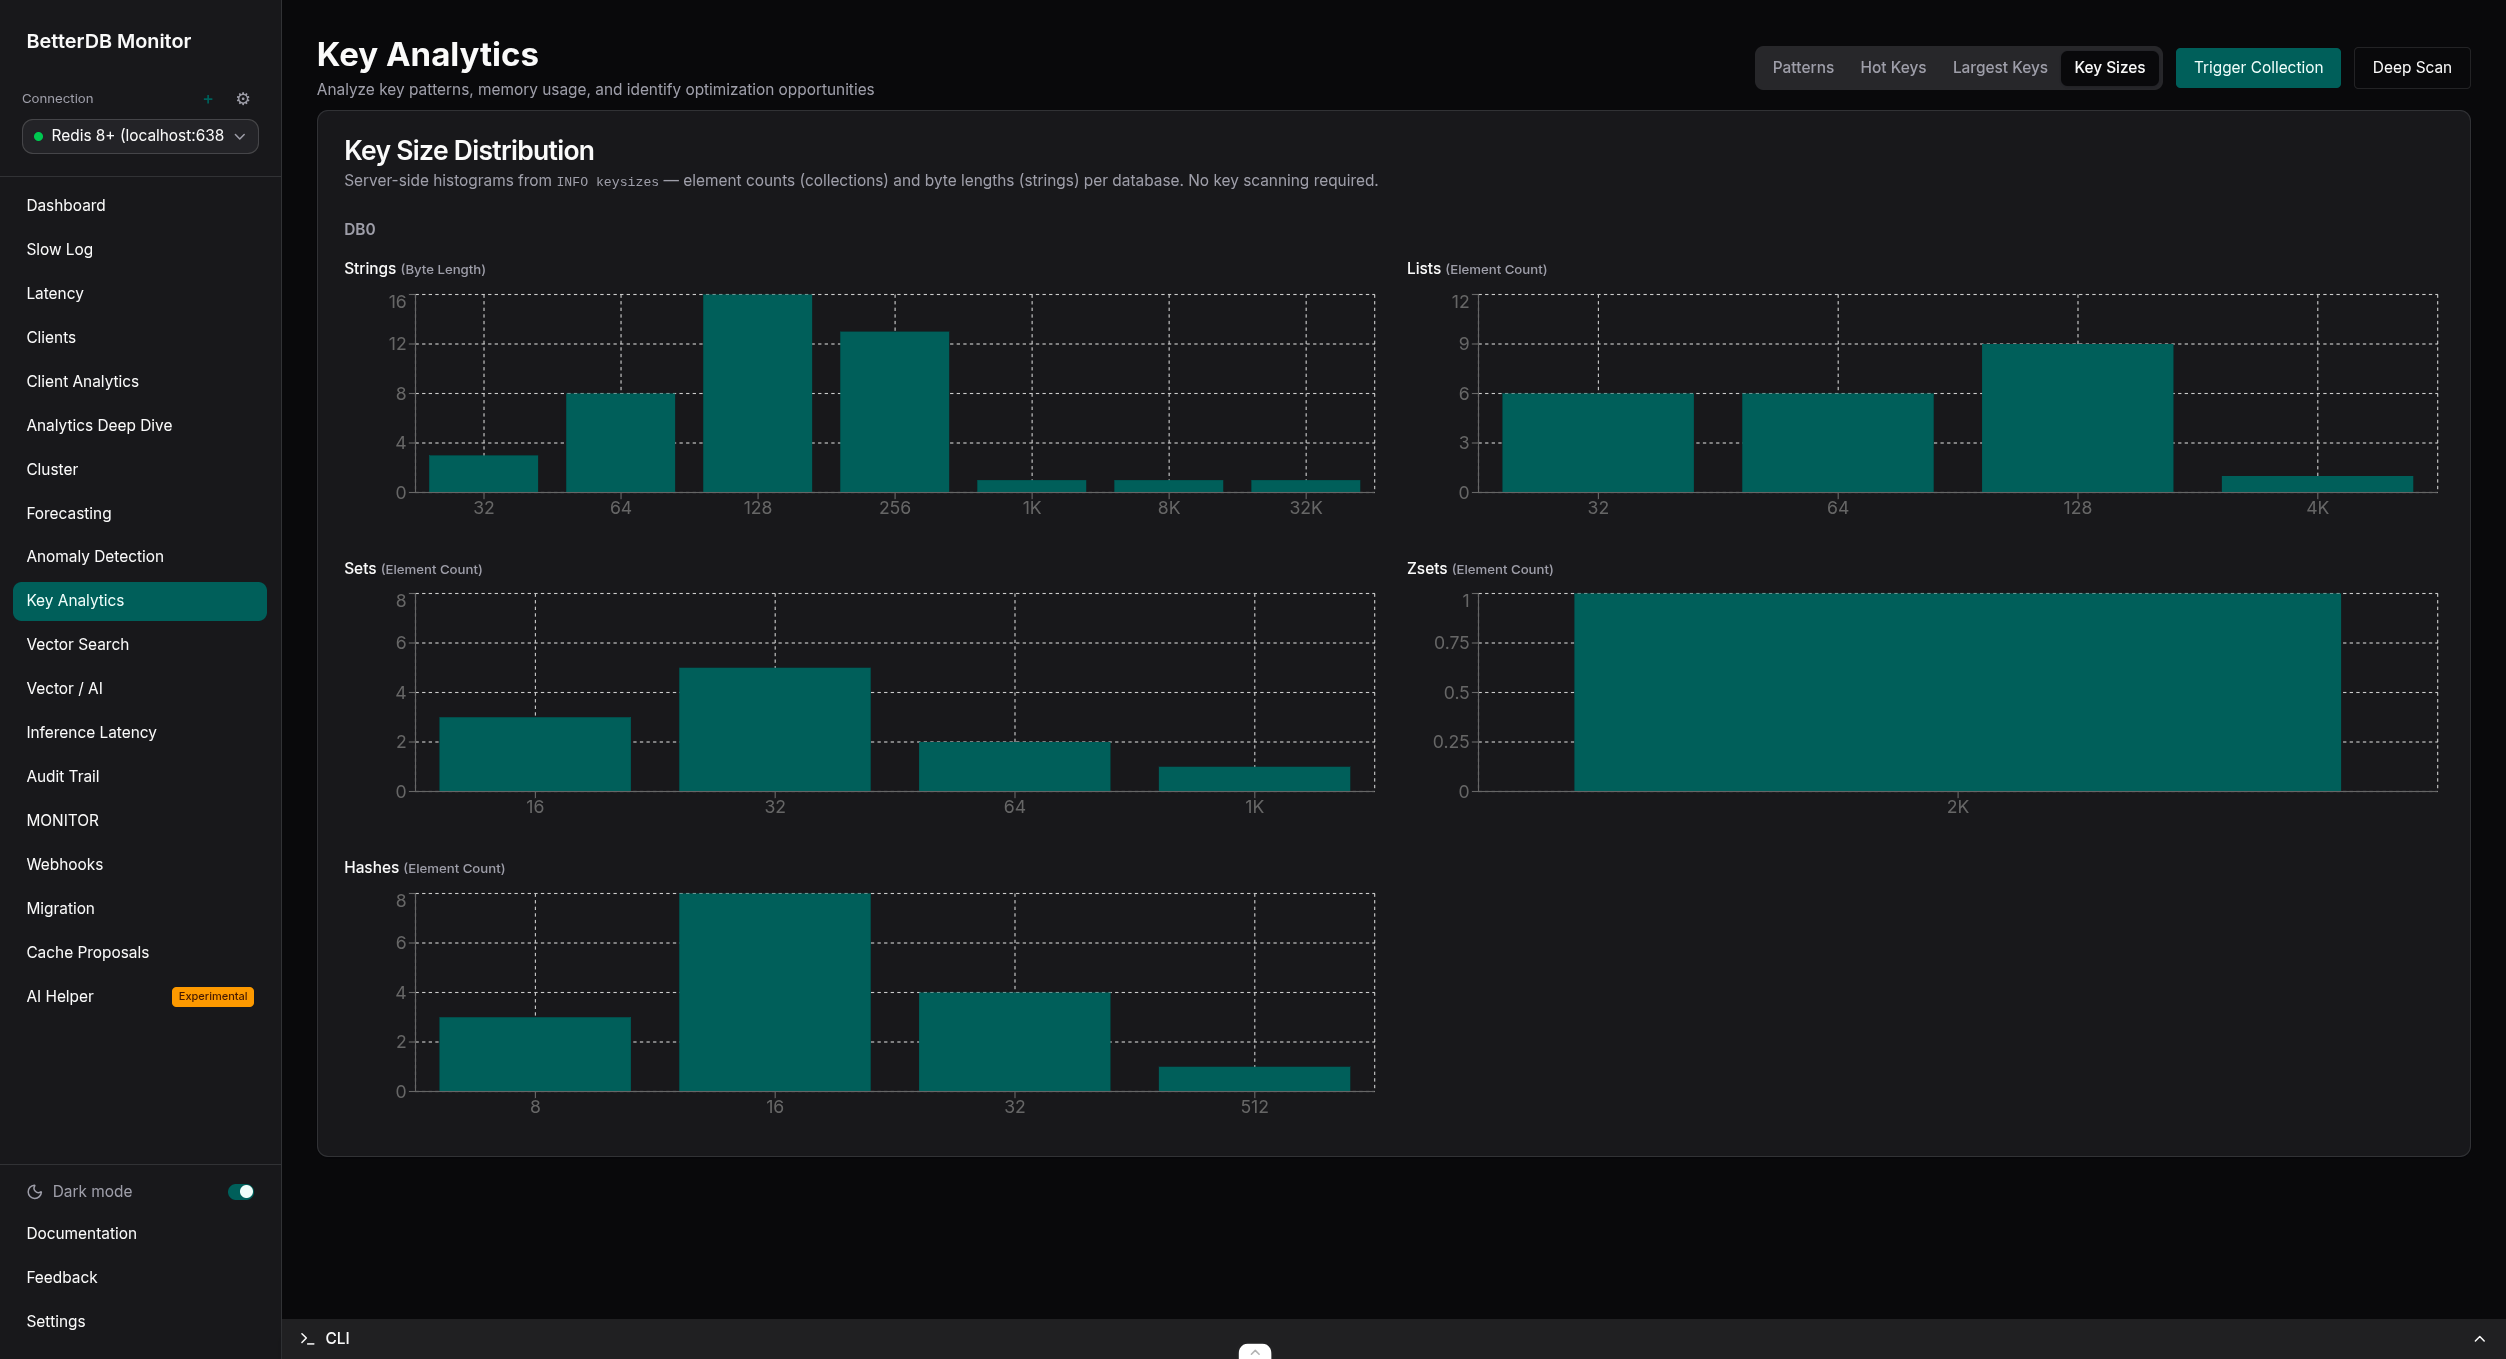
- Hot key tracking - top keys by access frequency with rank movement over time. Key Analytics (Pro, free in early access) adds type, TTL, and size distributions from live sampling.
- Cluster visibility - topology graphs, SLOT-STATS heatmaps, per-slot CPU and key distribution.
- CPU & I/O thread metrics - per-thread visibility that no Redis tool can provide.
- Client analytics - see exactly which service is responsible for what, attributed by client name and pattern.
- ACL audit trail - track who accessed what, persisted for compliance and post-incident debugging.
Understand and act
- Anomaly detection (Pro, free in early access) - automatic baseline learning with correlated events and plain-English diagnoses. 20+ detectors, no manual thresholds.
- Capacity forecasting - projected time-to-ceiling for memory, ops/sec, CPU, and fragmentation.
- Webhooks - HMAC-signed alert deliveries with retries and a full delivery log.
- Live migration - move between Redis and Valkey with a three-phase analysis, execution, and validation workflow.
Built for the AI era
- Vector search observability - FT.SEARCH ops/sec and latency with per-index health for valkey-search and RediSearch. See docs/vector-ai.
- Inference latency - p50/p95/p99 per index, with SLA breach alerts (Pro, free in early access).
- Semantic cache intelligence (Pro, free in early access) - hit-rate health, similarity-threshold recommendations, and an approve/reject proposal workflow. Agent memory observability included.
- AI traces - OTLP span waterfalls from your AI application, correlated with the live Valkey state underneath each request.
Plugs into everything
- MCP server - 60 tools for Claude Code, Cursor, or any MCP client via
@betterdb/mcp. - Prometheus endpoint - 100+
betterdb_*metrics. See docs/prometheus-metrics.md. - OpenTelemetry - mirror metrics and events to any OTLP backend.
- REST API - everything in the UI is an API call, documented via OpenAPI.
Access Your Data Your Way
| Interface | Details |
|---|---|
| Web UI | http://localhost:3001 |
| MCP server | npx @betterdb/mcp (stdio) - create a token under Settings → MCP Tokens |
| Prometheus | http://localhost:3001/api/prometheus/metrics |
| REST API (OpenAPI) | http://localhost:3001/docs |
| Health check | http://localhost:3001/api/health |
Note: In production builds (Docker, CLI) API routes are served under the
/apiprefix. In local development (pnpm dev) there is no prefix - e.g.http://localhost:3001/health.
Supported Databases
| Database | Minimum Version | Supported Features |
|---|---|---|
| Valkey | 8.0+ | All features including COMMANDLOG (8.1+) and CLUSTER SLOT-STATS |
| Redis | 6+ | All features except the Valkey-exclusive COMMANDLOG and CLUSTER SLOT-STATS |
The backend uses a unified adapter over the wire-compatible iovalkey client and auto-detects Valkey vs Redis from the INFO response (DB_TYPE=auto). Capabilities like COMMANDLOG and SLOT-STATS are detected per version, and the UI gracefully degrades when a feature isn't available.
Managed services are supported too - guides for AWS ElastiCache, MemoryDB, Redis Cloud, and Upstash live in docs/providers, and @betterdb/agent reaches VPC-only instances over an outbound WebSocket.
Docker Production Deployment
The Docker image contains the monitoring application (backend + frontend). It requires:
- A Valkey/Redis instance to monitor
- A PostgreSQL instance for data persistence (or use memory storage)
Run with PostgreSQL Storage
docker run -d \
  --name betterdb-monitor \
  -p 3001:3001 \
  -e DB_HOST=your-valkey-host \
  -e DB_PORT=6379 \
  -e DB_PASSWORD=your-password \
  -e STORAGE_TYPE=postgres \
  -e STORAGE_URL=postgresql://user:pass@postgres-host:5432/dbname \
  betterdb/monitor
Run on Custom Port
Set the PORT environment variable and match the -p mapping:
docker run -d \
  --name betterdb-monitor \
  -p 8080:8080 \
  -e PORT=8080 \
  -e DB_HOST=your-valkey-host \
  betterdb/monitor
Run with Host Network (Access localhost services)
If your Valkey and PostgreSQL are running on the same host:
docker run -d \
  --name betterdb-monitor \
  --network host \
  -e DB_HOST=localhost \
  -e DB_PORT=6380 \
  -e DB_PASSWORD=devpassword \
  -e STORAGE_TYPE=postgres \
  -e STORAGE_URL=postgresql://dev:devpass@localhost:5432/postgres \
  betterdb/monitor
Environment Variables
| Variable | Required | Default | Description |
|---|---|---|---|
DB_HOST | Yes | localhost | Valkey/Redis host to monitor |
DB_PORT | No | 6379 | Valkey/Redis port |
DB_PASSWORD | No | - | Valkey/Redis password |
DB_USERNAME | No | default | Valkey/Redis ACL username |
DB_TYPE | No | auto | Database type: auto, valkey, or redis |
STORAGE_TYPE | No | memory | Storage backend: memory or postgres |
STORAGE_URL | Conditional | - | PostgreSQL connection URL (required if STORAGE_TYPE=postgres) |
PORT | No | 3001 | Application HTTP port |
NODE_ENV | No | production | Node environment |
ANOMALY_DETECTION_ENABLED | No | true | Enable anomaly detection |
ANOMALY_PROMETHEUS_INTERVAL_MS | No | 30000 | Prometheus summary update interval (ms) |
BETTERDB_LICENSE_KEY | No | - | Online license key (Pro/Enterprise), validated over the network |
BETTERDB_OFFLINE_LICENSE_FILE | No | - | Path to a signed offline license .jwt for air-gapped hosts (see below) |
BETTERDB_OFFLINE_LICENSE | No | - | Offline license token as an inline JWT string |
BETTERDB_DATA_DIR | No | /app/data | Directory for persisted license state (mount a writable volume) |
BETTERDB_TELEMETRY | No | true | Set false to disable anonymous telemetry |
Full reference, including AI, OTLP export, webhook tuning, and health-gate thresholds: docs/configuration.md.
Licensing & Air-Gapped Support
BetterDB Monitor unlocks Pro/Enterprise features in one of two ways, depending on whether the host has internet access:
- Online license key - set
BETTERDB_LICENSE_KEY. The monitor validates it againstbetterdb.comand caches a locally-verified signed token, so your tier keeps working through short outages and restarts. - Offline / air-gapped license token - for hosts with no internet access at all (see below).
How air-gapped licensing works
Every entitlement is a signed RS256 JWT. The monitor verifies it locally against public keys embedded in the image - it never has to reach a license server to trust a token. So an air-gapped host can run paid tiers with zero connectivity:
- On an internet-connected machine, sign in at
betterdb.com/account/licenses and
download your offline license token (
.jwt, Pro/Enterprise). It contains no secrets and can't be tampered with - any edit breaks the signature. - Transfer it to the air-gapped host however you like (USB, config management, a Docker/Kubernetes secret mount).
- Provide it via
BETTERDB_OFFLINE_LICENSE_FILE(path),BETTERDB_OFFLINE_LICENSE(inline string), or paste it in the UI under Settings → License → "Air-gapped environment? Activate an offline license."
When an offline token is configured and no BETTERDB_LICENSE_KEY is set, the
monitor makes zero outbound requests - license checks, telemetry, and update
pings are all disabled. It runs the granted tier until the token expires (perpetual
licenses re-download yearly), then reverts to Community.
# fully offline - no network required
docker volume create betterdb-data
docker run --rm -v betterdb-data:/d alpine chown 1001:1001 /d   # volume writable by UID 1001 (one-time)

docker run -d --name betterdb-monitor -p 3001:3001 \
  -e DB_HOST=your-valkey-host -e DB_PORT=6379 -e DB_PASSWORD=your-password \
  -v /path/to/betterdb-license.jwt:/run/secrets/betterdb-license.jwt:ro \
  -e BETTERDB_OFFLINE_LICENSE_FILE=/run/secrets/betterdb-license.jwt \
  -v betterdb-data:/app/data \
  betterdb/monitor
Verify with GET /api/license/status → source: offline-token, mode: offline,
airGapped: true.
Persistence: mount a writable volume at
/app/dataso the offline license and the online outage-grace token survive restarts. The container runs as UID 1001, so a freshly-created volume must bechowned to it (shown above) - otherwise persistence fails withEACCES … license.jwt.
For the full flow, verification precedence, and key-rotation runbook see Offline & Air-Gapped Licenses and the Configuration reference.
Docker Image Details
- Base Image:
node:20-alpine - Compressed size: ~360MB (
latest/-no-ai) / ~640MB (versioned image with the experimental AI Helper's local-LLM dependencies) - Platforms:
linux/amd64,linux/arm64 - Contains: Backend API + Frontend static files (served by Fastify)
- Excluded: SQLite support (use PostgreSQL or Memory storage)
Container Operations
docker logs -f betterdb-monitor        # follow logs
docker stop betterdb-monitor           # stop
docker rm betterdb-monitor             # remove
Storage Backends
BetterDB Monitor persists audit trail, analytics, captures, and anomaly data to one of three backends:
| Backend | Use case | Notes |
|---|---|---|
memory | Testing, ephemeral environments | Default in Docker; all data lost on restart |
postgres | Production | STORAGE_TYPE=postgres + STORAGE_URL=postgresql://user:pass@host:port/db |
sqlite | Local development / CLI | Not included in Docker production images; STORAGE_SQLITE_FILEPATH optional |
Prometheus Metrics
Metrics are exposed at GET /api/prometheus/metrics in Prometheus text format: ACL audit, client connections, slowlog/commandlog patterns, memory, throughput, keyspace, replication, cluster slot stats, and Node.js runtime metrics - all prefixed betterdb_.
scrape_configs:
  - job_name: 'betterdb-monitor'
    metrics_path: '/api/prometheus/metrics'
    static_configs:
      - targets: ['your-monitor-host:3001']
Full metric reference: docs/prometheus-metrics.md and docs/prometheus-integration.md.
Development
Project Structure
betterdb-monitor/
├── apps/
│   ├── api/                 # NestJS backend (Fastify)
│   └── web/                 # React frontend (Vite)
├── packages/                # Published packages (see below)
├── docs/                    # Documentation site (Jekyll)
├── docker-compose.yml       # Local Valkey (port 6380) and Redis (port 6382) for testing
└── package.json             # Workspace root
Packages
This monorepo ships several standalone packages. See packages/ for the full list.
Tech Stack
- Backend: NestJS with Fastify adapter,
iovalkeyfor Valkey/Redis connections, TypeScript strict mode. Port 3001. - Frontend: React + TypeScript, Vite, TailwindCSS, Recharts. Dev server on port 5173.
- Monorepo: pnpm workspaces + Turborepo.
Local Setup
Prerequisites: Node.js >= 20.0.0, pnpm >= 9.0.0, Docker.
pnpm install
cp .env.example .env
pnpm docker:dev        # local Valkey (6380) and Redis (6382)
pnpm dev               # web on :5173, api on :3001
To connect to Redis instead of Valkey, set DB_PORT=6382 in .env.
pnpm dev:api           # API only
pnpm dev:web           # frontend only
pnpm docker:dev:down   # stop local databases
pnpm build             # production build
pnpm test              # API tests
Docker image builds:
pnpm docker:build      # local build
pnpm docker:publish    # multi-arch build & push (requires buildx)
Adding New Features
- Add new endpoints in
apps/api/src/ - Add corresponding API calls in
apps/web/src/api/ - Add shared types in
packages/shared/src/types/
Code Style
- TypeScript strict mode, explicit return types, no
any - ESLint + Prettier configured
License
- Content under
docs/is licensed under CC BY-SA 4.0. - Content under
proprietary/is covered by a commercial license (seeproprietary/LICENSE). These features are free during early access. - Everything else is MIT.
如有侵权请联系:admin#unsafe.sh