
Storage cost has always been a hot topic when log management discussion are on the table. In t 2026-6-17 08:49:40 Author: blog.nviso.eu(查看原文) 阅读量:6 收藏
Storage cost has always been a hot topic when log management discussion are on the table. In today’s enterprise ecosystems, organizations commonly ingest very high volumes of logs into their SIEM platforms from a wide range of sources, including servers, network devices, cloud environments, security tools, identity systems, and, in some cases, endpoint telemetry.
To fit each enterprise’s needs, Microsoft Sentinel [1] offers different log storage tiers. Lower-cost storage tiers, such as Auxiliary, provide clear cost benefits, but they are not designed for frequent data access in the same way as the Analytics tier. The Analytics tier is the high-performance optimized default tier but comes with high cost. Basic Logs is the low-cost limited-analysis tier, and Data Lake is the cheaper long-term cold-storage tier with slower performance .In this blog series, we will explore how Summary Rules, together with the Auxiliary or Data Lake tier, can help you reduce costs while still maintaining effective threat detection and monitoring capabilities.
What are Summary Rules?
Summary Rules [2] are scheduled KQL queries that aggregate log data and send the results to a custom log table in your Log Analytics workspace. This gives us the power to store large volumes of data in more cost-efficient tiers while retaining only the most relevant information for investigation purposes and even leveraging it within analytic rules (which will be discussed later).
The main benefits of using Summary Rules are:
- Optimized performance: Because the data is pre-aggregated according to the Summary Rule query, investigations can be conducted more efficiently and with greater focus on the summarized events. In addition, executing analytic rules or functions against this dataset is significantly faster than querying through very large volumes of log data.
- Cost Savings: Using Summary Rules to store aggregated information in analytic tables in combination with ingesting all initial data into lower-cost storage tiers, such as Auxiliary or Data Lake, is an effective strategy for significantly reducing overall SIEM costs.
The screenshots below show an example comparison of Summary Rule input and output based on a sample aggregation query. In this example, the input consists of 545 firewall events ingested into a Data Lake table. When Summary Rule runs, it applies an aggregate query based on SourceIP and combines all DestinationIPs and ThreatDescription values into a single event.


Data Tiers Comparison
To better understand how we can leverage the different storage capabilities offered by Microsoft we will go through he 3 data tiers available. The data tiers available are: Analytics, Basic, and Auxiliary/Data Lake. While all three are available for Microsoft Sentinel, Microsoft Defender table tier only supports Analytics and Auxiliary/Data Lake.
The Analytics tier is the standard “hot” tier for high-performance querying and indexing. It provides full query capabilities in Microsoft Defender and Azure portals, optimized query performance, archived log restore, and the complete set of real-time analytics features. Default retention is 30 days in Microsoft Sentinel and 30 days in Microsoft Defender XDR, with an option to extend for up to two years at an adjusted monthly long-term retention rate.
The Basic Logs tier is a cost-optimized tier designed for high-volume data that does not require frequent or advanced analysis. This tier enables the ingestion and retention of large volumes of telemetry at a significantly lower cost than the Analytics tier. It provides 30-day retention with optional extension up to 12 years. However, this cost efficiency comes with trade-offs; query capabilities are more limited, advanced KQL features and cross-table operations are restricted, and support for rich analytics and alerting scenarios is reduced. As a result, Basic Logs are best suited for troubleshooting, auditing, and occasional investigations rather than continuous monitoring.
The Data Lake tier provides cost-effective long-term retention for large data volumes (cold storage). Querying is supported but not optimized, so performance is generally slower, especially for larger time ranges or high log volumes. Additionally, each query incurs a small execution cost. It offers full query capabilities, although Summary Rules in Data Lake are limited to single-table full KQL queries (Lookup is supported). Log restore and data export are not supported. Default retention matches the Analytics tier, with extension available up to 12 years.
The following diagram describes retention between different tiers, as posted by Microsoft [3].

Below is a brief overview of the key differences between the Data Tiers currently offered by Microsoft:
| Feature Comparison | Analytics tier | Basic Logs | Auxiliary / Data lake tier |
| Ingestion cost | Standard Analytics including Pay-As-You-Go and | Per GB option with reduced cost | Per GB option with minimized cost |
| Cost per query execution | No | Cost based on GBs scanned per query | Cost based on GBs scanned per query |
| Query Capabilities | Full KQL query options | Full KQL on a single table (Supports lookup) | Full KQL on a single table (Supports lookup) |
| Query Optimization | Yes | No | No |
| Alert Support | Yes | No | No |
| Search jobs | Yes | Yes | Yes |
| Summary rules | Yes | Yes | Yes (Query capabilities limitation applies) |
| Retention period | 30 days for Sentinel 30 days for Defender XDR (Can be extended up to 2 years with additional charges) | 30 days, can be extended up to 12 years | Same as analytics retention, by default. Can be extended up to 12 years. |
| Data export | Yes | Yes | No |
Solution Overview
As mentioned earlier, Summary Rules can be used alongside Auxiliary/Data Lake tables to aggregate data. However, Summary Rules can not be used for raising alerts. To support the combined use of summary rules and the Data Lake, while also enabling alerting functionality, we have designed a solution that integrates both capabilities into the data ingestion and processing workflow.
The following section provides a high-level overview of the solution, including the main implementation steps and core features of the solution.
Splitting the Data
Enabling “Data Lake” gives us the option to use split transformation rules. At a glance, split transformation rules allow you to define which ingested events are stored in the Analytics tier and which are stored in the Data Lake.
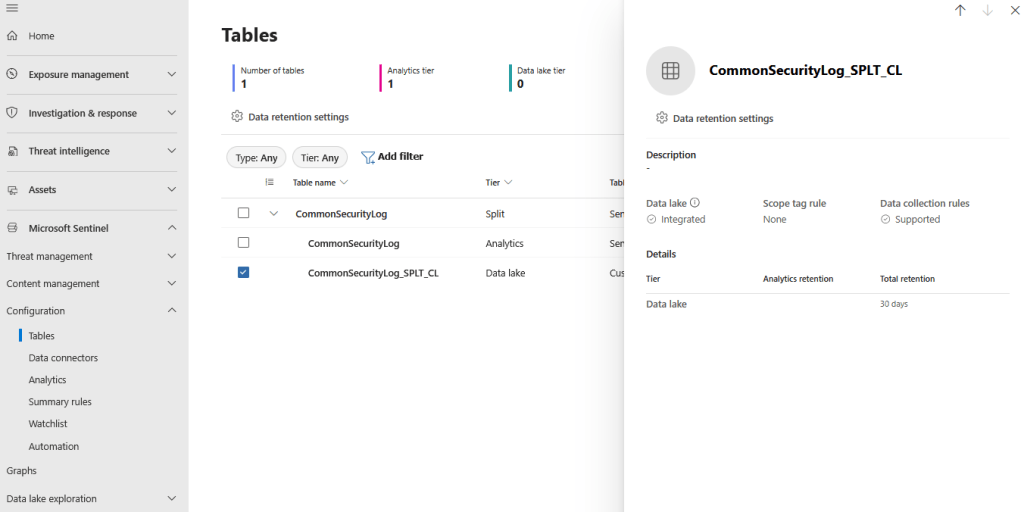
To set up a split rule, navigate to Defender Portal > Microsoft Sentinel > Configuration > Tables, select the table you want and choose split rule. Set up a valid KQL expression to define the data for the Analytics tier, enable the rule, and select save. The split data goes into a separate table with the same name, including the “_SPLT” suffix. You can also set up different retention for each of the tables. Split transformation is only available for tables in the Analytics tier.
Shown below are screenshots of the creation of a split transformation rule that stores everything in the Analytics tier except the “FW_Traffic”, which will be stored in the Data Lake tier.
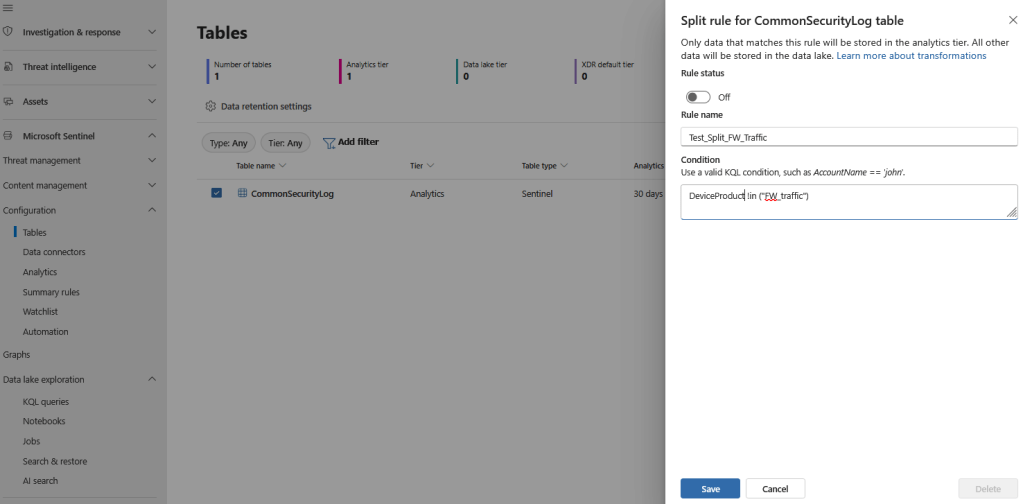
Of course, this is an optional action. All data can be stored directly in Data Lake if necessary and we can use the data lake table directly to our summary rule without a prior split. For the described example, we use the split method.
Summary Rule Creation
Following the data separation, the required logs are available in the Data Lake. At this stage, a Summary Rule can be created to process the dataset by running a predefined KQL query at scheduled intervals. The rule aggregates and structures the relevant data, storing the resulting output in a custom table, either new or an existing one, in the Analytics tier. It is also important to note that enabling Diagnostic Settings during Summary Rule creation allows us to monitor rule execution status and identify failed runs. As we will discuss later in this blog post series, these logs provide valuable operational visibility and can be used for troubleshooting, validation, and ongoing maintenance over time. Health monitoring of the Summary Rules will be documented in detail on part 4 of our blog post series.
Following Summary Rule creation, the execution is scheduled based on the run time and the frequency we choose. After a succesful run, we can identify the results by querying the new table that was created, “TestData_CL” in our case. For our sample events, the summary rules output results can be observed in the following caption.

Analytic Rule Creation
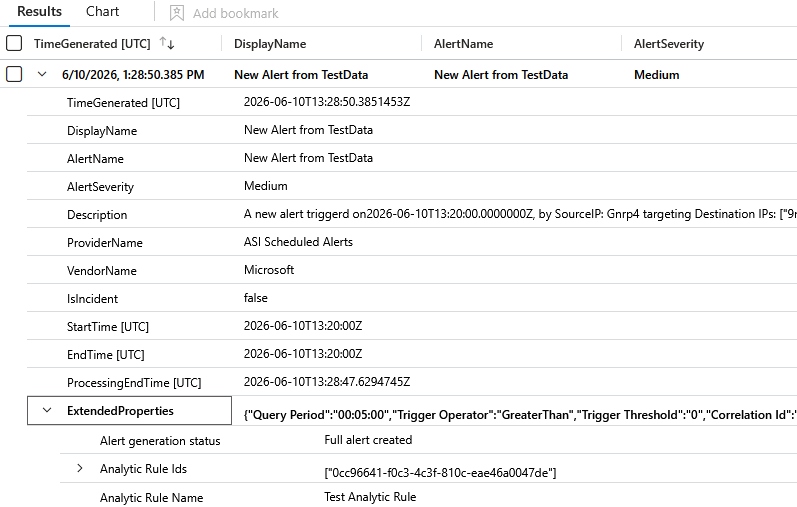
Summary Rules are useful for aggregating and normalizing data, but they are not designed to generate alerts. Therefore, we will create an analytic rule that uses the output aggregated logs from the Summary Rules as the queried dataset. Analytic rules allow us to generate alerts based on a specified KQL query and schedule them to run at regular intervals, ensuring continuous monitoring of the aggregated data. In the following example, we will create a simple analytic rule that triggers an alert for every entry is identified in the “TestData_CL”. This rule will run every 5 minutes and generate an alert with custom Alert Name and Alert Description.
Following the rule next run, we can identify the triggered alert and view the provided information.
Regarding Analytic Rules, based on the attack scenario that we want to detect, the query should focus on specific events originating by different log sources. In the following blog posts of this series, we will focus on 2 specific log sources, that are considered very noisy on most of the environments. These log sources are Firewall, that we will focus on the second blog post, and Microsoft DNS events, that we will describe on the third part of this series. On both of these blog posts we will present practical examples and analyze in-depth the provided solution.
In summary, the solution outlined above is presented in the following diagram.

Cost Analysis and Benefits
When Microsoft Sentinel Data Lake (SDL)[4] is enabled, data ingested into Analytics tier tables is automatically mirrored to the Data Lake tier for the same retention period at no additional cost. This enables organizations to perform deeper investigations and large-scale analytics on historical data while maintaining the performance and operational focus of the Analytics tier.
Data Lake storage is billed monthly on a per-GB basis for data that remains in the Data Lake tier beyond the Analytics tier retention period. Billing [5] is calculated using a compression ratio of 6:1. For example, retaining 120 GB of raw data would result in billing based on 20 GB of compressed storage.
Basic and Auxiliary tier tables support the full KQL language within the scope of a single table. However, they do not support multi-table operations, which means that operators requiring data to be combined across tables, such as join, find, and union, are not available. Meanwhile, SDL supports full KQL through jobs.
At the time of writing, the pricing differences between the different tiers in North Europe are as follows:
| Analytics | Basic | Auxiliary | Sentinel Data Lake | |
|---|---|---|---|---|
| Ingestion | €4.41 (pay-as-you-go tier) | €0.513 per GB | €0.052 per GB | €0.051 per GB |
| Processing | Included in the ingestion price | Included in the ingestion price | €0.103 per GB | €0.10 per GB |
| Querying | Included in the ingestion price | €0.00513 per GB | €0.00513 per GB | €0.0051 per GB |
| Retention | Up to 90 days free retention* €0.103 afterwards | €0.021 per GB ** | €0.021 per GB ** | €0.020 per GB *** |
* When Sentinel is enabled, Analytics tier includes up to 90 days of free retention in the ingestion price [6]
** 30 days of retention included
*** Uniform data compression rate of 6:1 across all data sources
Below is a cost estimation comparison between the different tiers for an average ingestion volume of 50 GB per day, with a retention period of 3 months in the North Europe region.
| Analytics | Basic | Sentinel Data Lake | |
|---|---|---|---|
| Ingestion | €5911.5 | €770 | €76.9 |
| Data Processing | Included in the ingestion price | Included in the ingestion price | €153.8 |
| Retention | Included in the ingestion price | €63 | €14.7 |
| Advanced Data Insights | €112.3 | N/A | €112.3 |
| Query | Included in the ingestion price | €10 (100 queries per month x 20 GB per query scanned) | €10.2 (100 queries per month x 20 GB per query scanned) |
| Total (approximately) | €6023 | €843 | €368 |
Basic tier is 86% cheaper than Analytics.
Sentinel Data Lake is approximately 94% cheaper than Analytics and 56% cheaper than Basic.
The above estimation does not take into account any free ingestion that may be available under certain licenses.
What about KQL Jobs?
Alongside Summary Rules, KQL jobs is another option for Data Lake exploration. KQL jobs consist of ad-hoc or scheduled KQL queries executed on data in the Microsoft Sentinel Data Lake (and federated tables).
However, there are key differences between them. According to Microsoft’s current official documentation, the key differences [7] are outlined in the following table:
| Feature | KQL Jobs | Summary Rules |
| Source data tier | Data Lake tier | Analytics, auxiliary, basic, data lake (System tables are not supported) |
| Query language | Operators adx(), arg() ,externaldata(), ingestion_time() are not supported. User-defined functions are not supported. | Analytics: Supports all KQL operators and functions, except workspaces(), app(), and resource() expressions, and for cross-service queries, ADX() and ARG() expressions. Also operations bag unpack, narrow, and pivot are not supported.Basic: Supports all KQL operators on a single table. User-defined functions are not supported. |
| Join support | Supported | Analytics tier: supported; Basic: join up to five Analytics tables using lookup() operator |
| Scheduling frequency | On-demand, daily, weekly, monthly | 20 minutes to 24 hours |
| Lookback period | Up to 12 years | Up to 1 day |
| Maximum number of results | Dependent on query timeout | 500,000 records |
| Pricing model | GB of data analyzed | Analytics tier: free; Basic and auxiliary tier: Data scan (Log Analytics pricing model) |
| Health monitoring | No | LASummaryLogs |
Based on these differences, the limited scheduling options of KQL jobs undermine the effectiveness of continuous monitoring, which can be performed with the Summary Rules. However, official documentation appears to be inconsistent, since creating a KQL job using UI of Microsoft Defender portal offers more frequency scheduling options.

Additionally, the ability to monitor the health of the summary rules, meaning successful or failed executions, makes them more suitable for use alongside analytic rules or analyst investigation. Currently for KQL jobs, only the Last Run Status information is available through job management UI in Microsoft Defender portal, and no historic information on the runs can be currently tracked. Health Logs availability ensures that one can more easily track, identify, and troubleshoot execution failures, rather than treating run issues as unresolved or hard-to-diagnose mysteries.
It should, however, be noted that the extended lookback period of KQL jobs makes them more suitable for threat hunting operations and for building baselines over longer timeframes.
Due to these limitations and the discrepancies in the documentation from the actual UI (which will be probably addressed and fixed by Microsoft), we have chosen to use Summary Rules instead of KQL jobs.
Wrapping Up
In the first part of this blog series, we compared the available data tiers in Microsoft Sentinel and provided a high-level overview of how summary rules can be used alongside Data Lake to reduce costs.
In the next blog posts of this series, we will present practical examples of how high-volume log sources can be used with Summary Rules. Specifically, the second part will focus on Firewall events and Summary Rules, followed by a third part that explores Microsoft DNS events in depth using Summary Rules and our solution. Finally, the last part of the series will cover health monitoring and alerting for Summary Rules.
References
[1] https://learn.microsoft.com/en-us/azure/sentinel/
[2] https://learn.microsoft.com/en-us/azure/azure-monitor/logs/summary-rules?tabs=api#how-summary-rules-work
[3] https://learn.microsoft.com/en-us/azure/sentinel/manage-data-overview#how-data-tiers-and-retention-work
[4] https://learn.microsoft.com/en-us/azure/sentinel/datalake/sentinel-lake-connectors
[5] https://learn.microsoft.com/en-us/azure/sentinel/billing
[6] https://learn.microsoft.com/en-us/azure/sentinel/manage-data-overview
[7] https://learn.microsoft.com/en-us/azure/sentinel/datalake/kql-jobs-summary-rules-search-jobs

Threat Detection Engineer
Thodoris is a member of NVISO's CSIRT & SOC Threat Detection Engineering team, primarily focusing on use case research and development. He enjoys exploring advanced security threats and uncovering new insights for effective detection.

Threat Detection Engineer
Christos is a member of NVISO’s CSIRT & SOC Threat Detection Engineering team, where he focuses on Threat Research and Detection Use Cases development.

SOC Engineer
Dimitris is a member of NVISO’s CSIRT&SOC SOC Engineering team, where he contributes to engineering initiatives that enhance security operations.
如有侵权请联系:admin#unsafe.sh