A look at Windows baseline behaviour through the lens of observability, telemetry, and detection engineering.
· 14 min read

Continuing along my theme of Malwareless Red Teaming and approach, today I'm going to dive into the wonderful world of windows baseline noise and blending in. I wanted to dive into the perspective from a red teamer but also to highlight some detection engineering fundamentals that many might overlook.
There's a habit in red teaming of over-focusing on tooling. And with the current hotness being AI all the things there's also a lack of some fundamental understanding among new researchers and blue teams of what baseline noise looks like within Windows.
People spend hours debating loaders, payload formats, and frameworks, but far less time thinking about the environment they're stepping into. That gap is where most detections come from and equally is where blending in is just as important.
In most cases, modern EDR doesn't really care whether something is "known bad" anymore and for a lot of them it's not even initial execution they are bothered about. It cares whether something looks out of place and what actions on objectives looks like.
While heuristics are still used on the really bad stuffs for the most part behavioural detection is the dominant model now. If what you're doing doesn't fit the environment, it stands out, even if you're trying to be all leet with the latest injection techniques and tooling.
Lab Queries
I have MDE and MDI both spun up in my lab(I built a Ludus config to help folks with all the pre-wiring needed) along with extensive telemetry to look at what different things do, mostly it started out to see what different processes were calling out to specific ports but has since grown in to much more.
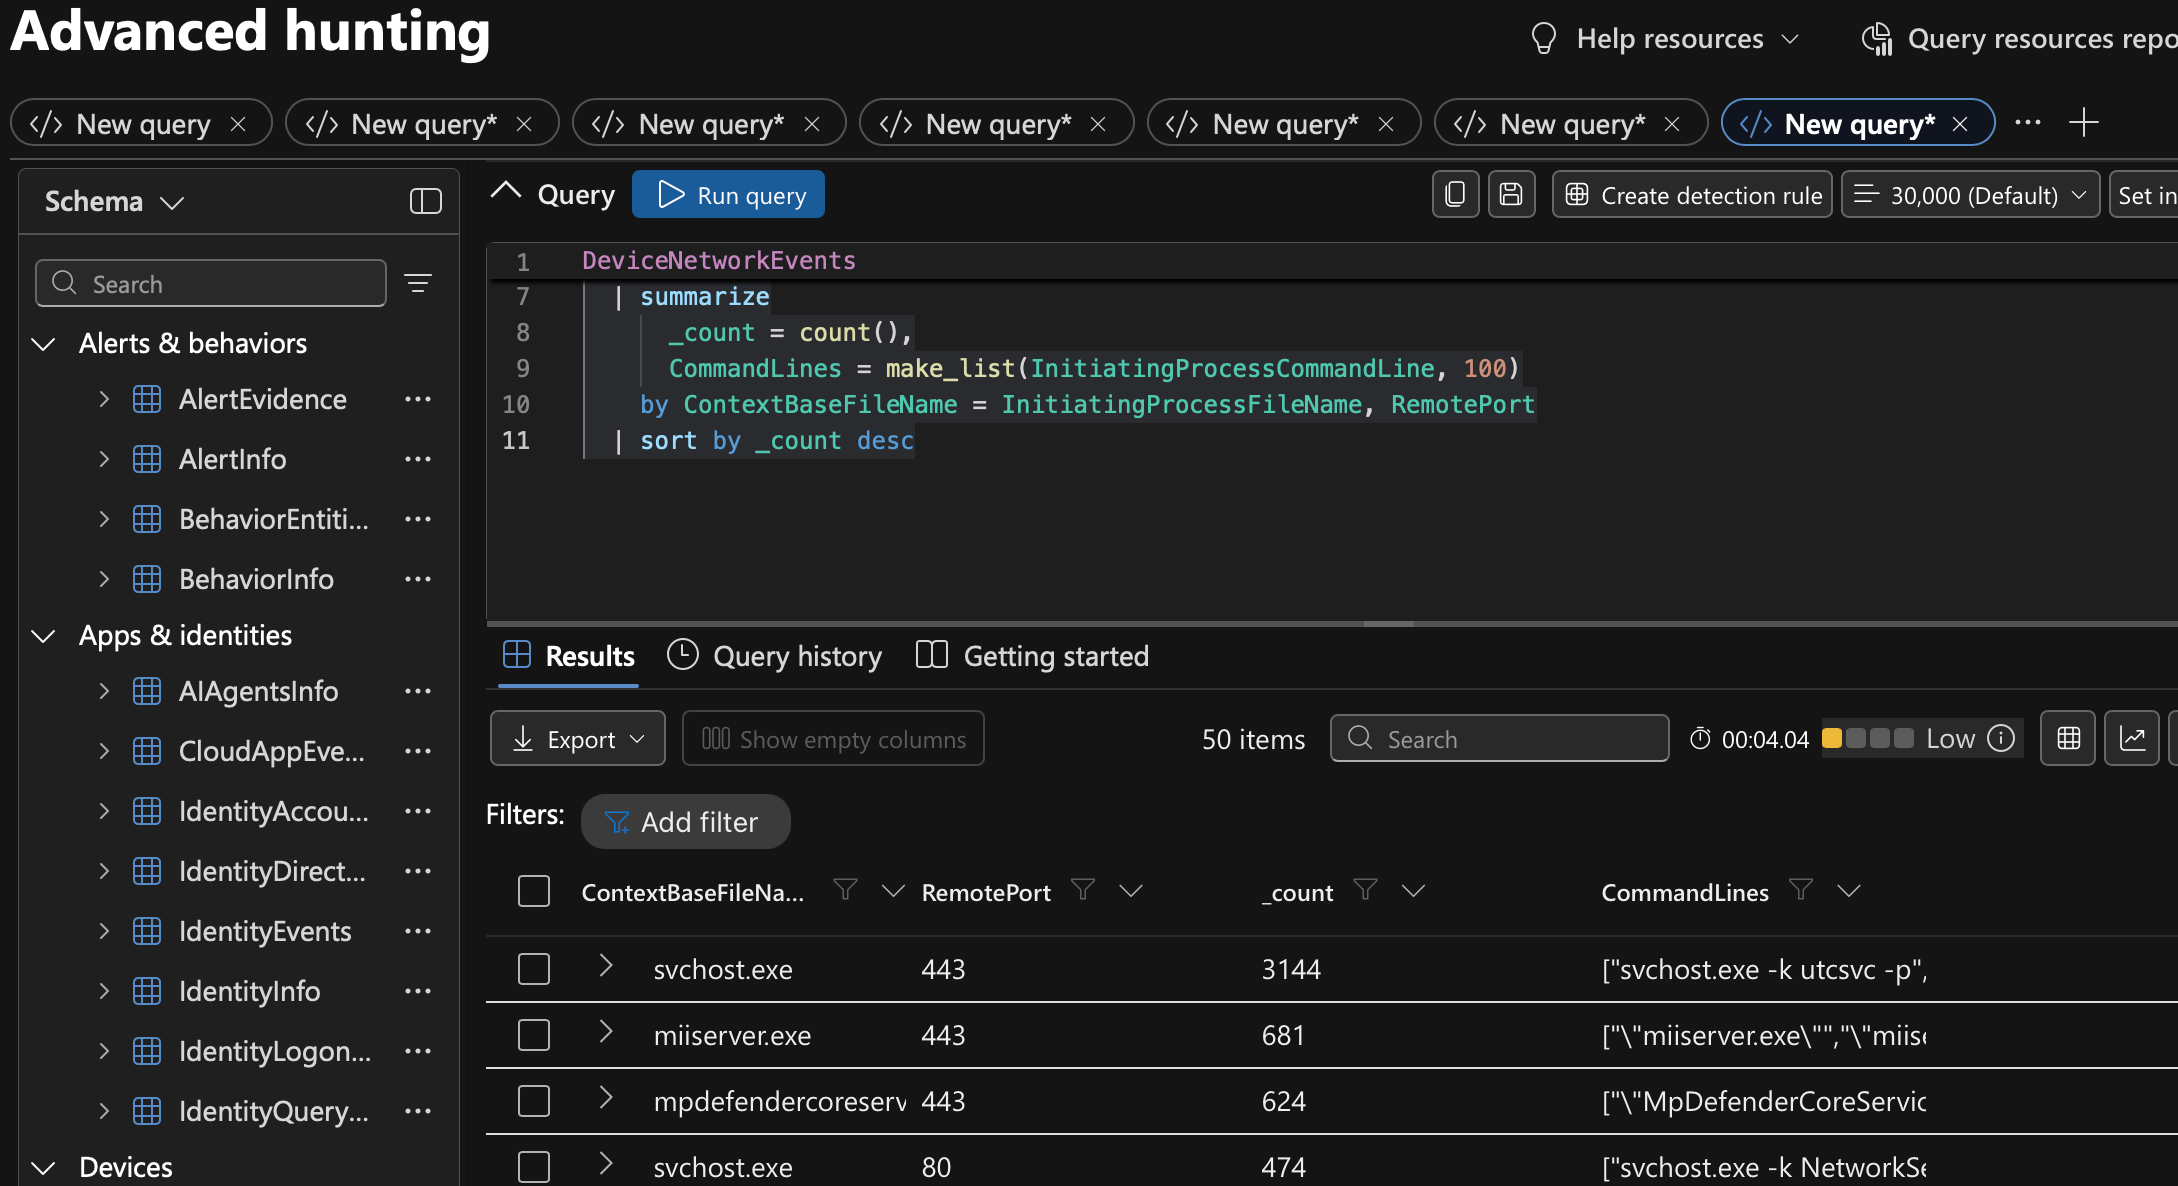
I ran the following KQL query against my MDE instance in my lab to pull out baseline noise of windows with a list of remote ports that each process connects to along with any relevant command line to better understand what processes do.
DeviceNetworkEvents
  | where Timestamp > ago(365d)
  | where ActionType == "ConnectionSuccess"
  | where isnotempty(InitiatingProcessFileName)
  | where RemotePort in (20, 21, 22, 23, 25, 53, 80, 88, 135, 137, 138, 139, 161, 162, 389, 443, 445, 464, 465, 587, 636, 1234, 1433, 1434, 1494, 2049, 2375, 2376, 2598, 3268, 3269,
  3306, 3389, 4443, 4444, 4445, 5353, 5432, 5900, 5901, 5985, 5986, 6379, 6667, 6697, 8000, 8080, 8443, 8888, 9090, 9200, 9300, 9443, 11211, 27017, 31337, 49443, 50050)
  | summarize
      _count = count(),
      CommandLines = make_list(InitiatingProcessCommandLine, 100)
    by ContextBaseFileName = InitiatingProcessFileName, RemotePort
  | sort by _count desc
This returned quite a few entries, mainly svchost.exe being the most noisy, which is to be expected as it launches many services and child processes for legitimate activities.

Looking at other processes here the defender ones are typically also pretty noisy because they're phoning home to get updates and dump telemetry but digging even deeper gets us some interesting looking binaries that may be good candidates for blending.
When Observability Spots Actions
In most cases, operators don't get caught because they used the wrong tool or technique but often the real reason tends to be that they behaved in a way nobody else in the environment does. I have spoken about this before in public talks explaining behaviours matter and when you're operating on certain hosts under
You can run entirely legitimate commands and still trigger alerts depending on the context of the commands things like the wrong time of day, wrong host, a pattern no real user would produce, it doesn't matter that it's native, the things that alert typically is that it's unusual, and unusual is enough to raise eyebrows of good threat hunters.
"Living off the land" assumes you understand what normal looks like. Most people skip that part and end up using built-in binaries to make noise in a slightly different way.
I gathered this list and built out several other queries to get more juicy data from the MDE EDR sensor, filtering out for known LOLBAS and hunting out more interesting data:
let LOLBAS = dynamic([
      "powershell.exe","pwsh.exe","cmd.exe","wscript.exe","cscript.exe", "mshta.exe","msbuild.exe","installutil.exe","regasm.exe","regsvcs.exe", "microsoft.workflow.compiler.exe","cmstp.exe","xwizard.exe","syncappvpublishingserver.exe", "presentationhost.exe","runscripthelper.exe","fsi.exe","csi.exe","rcsi.exe", "rundll32.exe","regsvr32.exe","odbcconf.exe","infdefaultinstall.exe", "ieexec.exe","mavinject.exe","ttdinject.exe","verclsid.exe","pcalua.exe", "certutil.exe","bitsadmin.exe","expand.exe","extrac32.exe","replace.exe", "makecab.exe","esentutl.exe","ftp.exe","dfsvc.exe","desktopimgdownldr.exe", "finger.exe","wsl.exe","appvlp.exe","msiexec.exe","wmic.exe","forfiles.exe","pcwrun.exe","gpscript.exe","hh.exe","ie4uinit.exe","sfc.exe","tttracer.exe", "rpcping.exe","diskshadow.exe","ntdsutil.exe","dnscmd.exe","nltest.exe", "psr.exe","msdt.exe","rasautou.exe","pktmon.exe","msdeploy.exe","tracker.exe", "bginfo.exe","cdb.exe","dxcap.exe","te.exe","msxsl.exe","wab.exe", "squirrel.exe","update.exe","findstr.exe","print.exe","eudcedit.exe"
  ]);
  DeviceNetworkEvents
  | where Timestamp > ago(365d)
  | where ActionType == "ConnectionSuccess"
  | where isnotempty(InitiatingProcessFileName)
  | where InitiatingProcessFileName !in~ (LOLBAS)
  | where RemoteIPType == "Public"
  | project
      Timestamp,
      DeviceName,
      Process = InitiatingProcessFileName,
      CommandLine = InitiatingProcessCommandLine,
      Parent = InitiatingProcessParentFileName,
      Account = InitiatingProcessAccountName,
      IntegrityLevel = InitiatingProcessIntegrityLevel,
      RemoteIP,
      RemoteUrl,
      RemotePort,
      SHA256 = InitiatingProcessSHA256
  | sort by Timestamp desc
To build out an accurate baseline of where the things differ from the norm and to allow a baseline understanding of my lab environment. Now that said granted enterprise environments tend to be far more noisy this is not fully represented in a single query but gives you an idea of things to consider.
Other things that can be interesting are crash dumps and telemetry, to do this Microsoft has a service called Watson that handily gathers this info and the following query will net you that data:
DeviceProcessEvents
| where Timestamp > ago(365d)
| where InitiatingProcessFileName == "taskhostw.exe"
or FileName =~ "WerFault.exe"
or FileName =~ "WerFaultSecure.exe"
| where InitiatingProcessAccountName =~ "domainadmin"
or AccountName =~ "domainadmin"
| project Timestamp, DeviceName, FileName, ProcessCommandLine,
InitiatingProcessFileName, InitiatingProcessCommandLine, AccountName
| sort by Timestamp desc
Process Behaviour
Process behaviour is one of the strongest signals, and the part that matters most is how things get spawned. Parent-child relationships get watched closely in any security tooling, thus a command prompt launched from Explorer and used interactively is expected:
explorer.exe → cmd.exe → whoami
However the commands being used may be categorised differently, for example if you spawn command prompt and start doing recon commands when the user running the commands never uses cmd.exe for example that may stick out as an anomaly. The same command prompt spawned by Word and immediately executing an encoded PowerShell command is not:
winword.exe → cmd.exe → powershell.exe -enc JABjAGwAaQBlAG4A...
The commands themselves might be legitimate, but the chain tells a different story. Defenders write Sysmon rules specifically for this, a config entry like the following catches Office applications spawning shells:
<RuleGroup groupRelation="or">
  <ProcessCreate onmatch="include">
    <ParentImage condition="contains any">winword.exe;excel.exe;powerpnt.exe</ParentImage>
    <Image condition="contains any">cmd.exe;powershell.exe;wscript.exe;mshta.exe</Image>
  </ProcessCreate>
</RuleGroup>
Execution frequency is another one that catches a lot of people out, something that runs once may pass unnoticed. The same thing running across multiple hosts in a short window becomes a pattern and something that can be tracked, once there's a pattern, there's a detection that can be formed.
Location on disk feeds into this too. System directories behave differently to user-writable paths. If something normally runs from C:\Windows\System32\ but suddenly appears in C:\Users\Public\Downloads\ or a temp directory, that deviation alone can draw attention; A KQL query in Defender for Endpoint looking for this might be:
DeviceProcessEvents
| where Timestamp > ago(24h)
| where FolderPath startswith "C:\\Users\\"
    or FolderPath startswith "C:\\Temp\\"
| where FileName in ("cmd.exe", "powershell.exe", "rundll32.exe", "mshta.exe")
| summarize count() by DeviceName, FileName, FolderPath, InitiatingProcessFileName
Network Behaviour
Looking across a few weeks of MDE data, most workstations in my lab talked to a remarkably small set of destinations. DNS, AD, Defender updates, a few Microsoft endpoints, then mostly silence. However, when those patterns change, things get noticed fast. A workstation generating bursts of Kerberos traffic it never produced before, or making DNS requests to high-entropy domains like a3x7k9q2.xyz, will get picked up. A Splunk query hunting for DNS requests to domains with unusual character distributions might look like:
index=dns sourcetype=stream:dns
| eval domain_length=len(query)
| eval char_variety=mvcount(mvdedup(split(query,"")))
| where domain_length > 20 AND char_variety / domain_length > 0.7
| stats count by src_ip, query
| where count < 3
Authentication Patterns
When targeting users, the ones that fall out of scripts tend to be service accounts, while service accounts tend to behave consistently and rarely will be found to be using interactive login, whereas users log in at roughly the same times each day, and privileged access follows whatever workflow the org has set up for it.
When an account starts logging in at unusual hours, or authentication activity spikes across multiple hosts, SIEM and User Behaviour Analytics systems pick it up. A Sigma rule for detecting anomalous logon patterns looks like this:
title: Logon from Unusual Source to Multiple Hosts
logsource:
  product: windows
  service: security
detection:
  selection:
    EventID: 4624
    LogonType: 3
  timeframe: 15m
  condition: selection | count(TargetHostname) by SourceAddress > 5
level: medium
My goal is to baseline windows and blend into the noise, the whole model is built around spotting things that look different from what normally happens.
Why Operators Still Trip Alerts
Most detections come down to basic mistakes or wrong assumptions, repetition is a big one. Running the same enumeration command across multiple hosts in quick succession feels efficient, but it creates a pattern that would not normally exist. Something as simple as this:
net group "Domain Admins" /domain
Run that on one workstation and where an environment might already have a baseline run and nobody might blink but if it's run from a user for example who never uses the net.exe or net1.exe binaries it'll raise an alert. Run it across fifteen machines in two minutes and you've created a correlation event that didn't exist before. The commands are legitimate however as we've been learning, the pattern isn't.
Another mistake is using commands that don't match the environment, every org has its own quirks, for example many Red Team operators say that PowerShell is dead but that's only applicable to specific environments and for many it is very much still alive in 2026. Some use PowerShell for everything, like accounts and others running scripts regularly thus your activity might blend in happily. Others barely touch it and rely on SCCM or third-party RMM tools, which is another area that many overlook, the use of RMM tools sometimes is business as normal and if you're using them too you're actually blending in. If nobody in the environment runs nltest or dsquery from workstations, doing so makes you visible pretty quickly.
You don't need advanced detection capability to catch any of this, basic log correlation handles most of it. Here's some KQL and sigma rules to help you build a baseline understanding:
let window = 15m;
  let host_threshold = 5;
  let reconBins = dynamic(["net.exe","net1.exe","nltest.exe","dsquery.exe","dsget.exe","quser.exe"]);
  let reconArgs = dynamic(["domain admins","enterprise admins","/domain","/dclist","domain_trusts","trusted_domains","group","/all"]);
  DeviceProcessEvents
  | where Timestamp > ago(1h)
  | where FileName in~ (reconBins)
  | where ProcessCommandLine has_any (reconArgs)
  | summarize hosts = dcount(DeviceName),
              host_list = make_set(DeviceName, 50),
              cmds = make_set(ProcessCommandLine, 20),
              firstSeen = min(Timestamp), lastSeen = max(Timestamp)
          by AccountName, AccountSid, bin(Timestamp, window)
  | where hosts >= host_threshold and lastSeen - firstSeen < window
  | project firstSeen, lastSeen, AccountName, AccountSid, hosts, host_list, cmds
  | sort by hosts desc
title: AD Recon Command (Base Rule)
id: a1f3c2e0-1111-4a2b-9c3d-recon000001
status: experimental
logsource:
category: process_creation
product: windows
detection:
selection_bin:
Image|endswith:
- '\net.exe'
- '\net1.exe'
- '\nltest.exe'
- '\dsquery.exe'
- '\dsget.exe'
selection_args:
CommandLine|contains:
- 'domain admins'
- 'enterprise admins'
- '/domain'
- '/dclist'
- 'domain_trusts'
- 'trusted_domains'
condition: selection_bin and selection_args
level: medium
---
title: AD Recon Command Fan-Out Across Multiple Hosts
id: a1f3c2e0-2222-4a2b-9c3d-recon000002
status: experimental
correlation:
type: value_count
rules:
- a1f3c2e0-1111-4a2b-9c3d-recon000001
group-by:
- User
timespan: 15m
condition:
gte: 6
field: Computer
level: highIf you want to pull out data on first time usage of binaries from a user try this query:
let baseline = 30d;
  let recent = 1d;
  let reconBins = dynamic(["net.exe","net1.exe","nltest.exe","dsquery.exe","dsget.exe"]);
  let seenBefore =
      DeviceProcessEvents
      | where Timestamp between (ago(baseline) .. ago(recent))
      | where FileName in~ (reconBins)
      | distinct AccountName, FileName;
  DeviceProcessEvents
  | where Timestamp > ago(recent)
  | where FileName in~ (reconBins)
  | where ProcessCommandLine has_any ("domain","group","/all","trust","dclist")
  | join kind=leftanti seenBefore on AccountName, FileName
  | project Timestamp, DeviceName, AccountName, FileName, ProcessCommandLine, InitiatingProcessFileName
  | sort by Timestamp desc
Sigma:
 title: Recon Binary Execution (for First-Seen Baselining)
  id: a1f3c2e0-3333-4a2b-9c3d-recon000003
  status: experimental
  logsource:
    category: process_creation
    product: windows
  detection:
    selection:
      Image|endswith:
        - '\net.exe'
        - '\net1.exe'
        - '\nltest.exe'
        - '\dsquery.exe'
        - '\dsget.exe'
      CommandLine|contains:
        - 'domain'
        - 'group'
        - 'trust'
        - 'dclist'
        - '/all'
    condition: selection
  fields:
    - User
    - Computer
    - Image
    - CommandLine
  level: medium
Building a Baseline Before You Act
One of the first things I do these days is nothing just watch. We can learn a lot about an environment with minimal interaction and its one of the reasons I have an observability lab setup to identify what a normal out the box install of Windows looks like both on workstation and server to see the differences. If you don't have a lab available or just want to profile your surroundings on a host here are some commands that give useful context on a host:
# What's running?
tasklist /v

# Who's logged in?
qwinsta
query user

# What's talking on the network?
netstat -ano | findstr ESTABLISHED

# What scheduled tasks exist?
schtasks /query /fo LIST /v

# What services are running?
sc query state=all | findstr /i "running"
Keep in mind that these aren't invisible to run and going back to what I've been saying throughout this post understanding your environment is key. Sysmon Event ID 1 (Process Create) will log each of these. Command-line auditing (Event ID 4688 with command line logging enabled) will capture the arguments and if there's an EDR in play it'll snaffle up everything too. You're going to generate some telemetry no matter what but the point is to keep that telemetry looking like something the environment already produces.
Understanding how people actually use the environment is the other half of this. When do users log in? What applications are common? How do admins do their work? A developer box running VS Code, Git, and Node looks nothing like a finance workstation running Excel and SAP. The question worth asking on any engagement isn't "what can I run?" but "what would be normal here?"
Profiling the Baseline Yourself
If you want to go deeper, build your own view of what normal looks like and what your typical operator actions might look like to the other side, it's something I've learnt the more I do this job is to always look at things from the other side be it you're on the red or blue side of the house and look at how things react and act.
Process Profiling
Sysmon Event ID 1 gives you process creation with parent-child relationships. Collecting this over a period of time shows you which processes are common, how they get spawned, and what typical chains look like. A quick PowerShell one-liner to pull recent process creation events:
Get-WinEvent -FilterHashtable @{LogName='Microsoft-Windows-Sysmon/Operational'; Id=1} -MaxEvents 500 |
  Select-Object @{N='Time';E={$_.TimeCreated}},
    @{N='Parent';E={$_.Properties[20].Value}},
    @{N='Process';E={$_.Properties[4].Value}},
    @{N='CommandLine';E={$_.Properties[10].Value}} |
  Format-Table -AutoSize
You can also use ETW tracing directly if Sysmon isn't available or you want to get more broader coverage with built in tooling:
# Start a trace for process events
logman create trace ProcessTrace -p Microsoft-Windows-Kernel-Process -o C:\Temp\proctrace.etl -ets
# Let it run for a while, then stop
logman stop ProcessTrace -ets
Both give you a decent understanding of what's running and what actions look like.
Network Profiling
Sysmon Event ID 3 (Network Connection) captures outbound connections with destination IPs and ports. Collecting DNS queries from Event ID 22 shows you what domains the host normally resolves. Over a day or two of collection, you'll have a solid picture of what "normal traffic" means for that machine.
# Pull recent DNS query events from Sysmon
Get-WinEvent -FilterHashtable @{LogName='Microsoft-Windows-Sysmon/Operational'; Id=22} -MaxEvents 200 |
  Select-Object @{N='Time';E={$_.TimeCreated}},
    @{N='Query';E={$_.Properties[2].Value}},
    @{N='Process';E={$_.Properties[4].Value}} |
  Group-Object Query | Sort-Object Count -Descending | Select-Object -First 30
Services and Scheduled Tasks
Many environments have a lot of background automation, and that automation creates noise you can operate within. Knowing when scheduled tasks run and what services restart gives you windows where additional process creation is less likely to be noticed.
# Export scheduled tasks with their triggers and last run times
Get-ScheduledTask | Where-Object {$_.State -ne 'Disabled'} |
  Get-ScheduledTaskInfo | Select-Object TaskName, LastRunTime, NextRunTime |
  Sort-Object NextRunTime
Timing
There's a common assumption that operating out of hours is safer, that isn't always true, in some environments, any activity at 2am is an instant red flag because nothing should be happening and thus sticking out from the norm. In others, business hours are when the SOC is fully staffed and watching everything closely and for those places that don't have a 24/7 coverage out of hours might be the prime time to strike as you're outwith those operating hours.
There's no single correct way of doing timings but the table below shows some generic examples:
| Activity | During business hours | After hours |
|---|---|---|
| AD enumeration from workstation | Blends in with normal admin work | Why is this machine active at 3am? |
| Kerberos authentication to DCs | Expected | Stands out in low-traffic periods |
| SMB access to file shares | Normal user behaviour | Could trigger after-hours access alerts |
| PowerShell execution | Common on admin machines | Unusual on most workstations |
What Defenders See
Defenders build their picture from multiple data sources; Sysmon telemetry, EDR agent data, Windows Security Event Logs, DNS logs, and network flow data all feed into the overall view. Good defenders look for deviation from the norm, a process that rarely runs, a parent-child chain that doesn't normally occur, an authentication spike that has no business being there.
A Sysmon config tuned for a specific environment might have hundreds of exclusion rules for known-good process chains, and anything that falls outside those exclusions gets surfaced. That's why understanding what's already excluded (what's considered normal) tells you where you can operate without generating alerts. For example, if the environment runs a software deployment tool that regularly spawns msiexec.exe from a management agent, that chain is excluded. But msiexec.exe spawned by cmd.exe from a user session? That generates an alert.
Take a concrete example. An operator runs these commands to enumerate domain information:
nltest /dclist:contoso.local
net group "Domain Admins" /domain
net localgroup administrators
whoami /priv
Each one is a built-in Windows binary. Nothing "malicious" about any of them individually, however execute that sequence across twenty hosts in a short period like 10 minutes and the SIEM correlates it as reconnaissance activity.
index=wineventlog EventCode=4688
| search (CommandLine="*nltest*" OR CommandLine="*net group*" OR CommandLine="*net localgroup*")
| stats dc(ComputerName) as host_count, values(CommandLine) as commands by Account_Name
| where host_count > 3
Three hosts might be an admin doing their job during business hours but a giant spike both in hours or out of hours might look out of place.
Blending In Properly
Blending in means operating within the bounds of what is expected. That means slowing down, avoid running enumeration in loops or letting tools spray commands across the network. Match how real administrators work, which is why build, break, defend, fix is important, if you understand how to build things like a sysadmin you've a better chance of blending in. For example, if the IT team uses SCCM for remote management rather than PSExec, don't touch PSExec and use SCCM to your advantage, likewise if no on premise tools are being used, stick to cloud like intone and other Azure agents.
Building A Lab
If you want to get better at this, build a small lab and see it for yourself. To get the full picture you likely want to have a domain controller, a couple of workstations, and some logging. Install Sysmon with a community config like SwiftOnSecurity's or olafhartong's modular config. Forward events to an Elastic stack or Splunk instance or if you have a few quid pick up an E5 license and deploy MDE and MDI to see what traffic generates specific alerts, get into the advanced hunting and look for patterns and build your own queries. Generate some normal user activity for a few days: browsing, opening Office docs, checking email, running updates.
After a while you start spotting the things that don’t fit. Sometimes that’s attacker-looking behaviour, sometimes it’s a broken application, and sometimes it’s just Windows being Windows, which is something I’ve been diving into a lot more lately.
Once you spend enough time looking at telemetry, you stop thinking only about binaries and execution locations and begin to develop thinking about behaviour. From there, start introducing small deviations. Run a net group query and see how it lands. Launch PowerShell from an unusual parent process, make a few lateral movement attempts and watch what lights up in the logs, and what doesn’t.
Behavioural detection punishes careless tradecraft. Learning baselines gives you a way to understand what normal actually looks like before you start changing it.