Tenable Research has developed a graph-based model linking 600+ threat groups to real-world customer 2026-5-27 16:25:0 Author: www.tenable.com(查看原文) 阅读量:49 收藏
Tenable Research has developed a graph-based model linking 600+ threat groups to real-world customer exposures. It reveals which vulnerabilities sit at the intersection of severity, active exploitation, and organizational risk.
Key takeaways
- The "patch everything" strategy is dead: Vulnerability prioritization based on exploitation risk offers a path forward. A directed graph model linking 600+ threat actors to vulnerabilities in 7,800 customer environments reveals that 68% of organizations carry at least one CVE previously exploited by a named adversary, and 321 tracked threat groups can reach at least one customer environment through an active vulnerability.
- Prevalence of "Elite Arsenal" CVEs requires immediate attention: The 242 "Elite Arsenal" CVEs — those meeting all three criteria of critical VPR (≥ 9), CISA KEV listing, and documented threat group exploitation — are nearly universally present across the studied customer base, with 241 of 242 actively detected. More than half are five or more years old, and 78% of the persistently exploited core are simultaneously weaponized by nation-state APTs, commodity malware operators, and ransomware gangs.
- Non-CVE exposures are universally dangerous: Non-CVE exposures, including misconfigurations, weak credentials, and end-of-life software, are present in virtually 100% of studied organizations, with 60% carrying at least one that maps to a tracked threat actor's preferred techniques. Preliminary modeling suggests these exposures may confer more breach risk than CVE-linked findings, yet no industry-standard scoring infrastructure exists to prioritize them.
While the first two posts in this blog series documented the accelerating vulnerability flood and the widening remediation gap, today we answer the outstanding question: Where do these forces actually collide inside customer environments? Using a directed graph model that maps more than 600 tracked threat groups to vulnerabilities observed across 7,800 organizations, Tenable Research shows you which exposures likely carry the highest real-world risk and where defenders should focus their finite remediation capacity.
Understanding the vulnerability and remediation landscape
The case for urgency has been made. In the first post, Tenable Research documented the convergence of three forces reshaping the vulnerability management landscape:
- AI-driven vulnerability discovery tools accelerating CVE volume toward a projected 59,000 disclosures in 2026
- NIST’s decision to scale back enrichment of the National Vulnerability Database (NVD) to only three narrow categories
- The resulting structural gap for organizations that depend on public severity metadata to prioritize patching
The second post, produced in collaboration with the Verizon 2026 Data Breach Investigations Report (DBIR), quantified the remediation side of the equation:
- Vulnerability exploitation has surged to become the leading initial access vector at 31% of breaches.
- Median time-to-patch has grown from 32 to 43 days.
- Only 26% of the Cybersecurity and Infrastructure Security Agency’s (CISA) Known Exploited Vulnerabilities (KEV) are fully remediated across surveyed organizations.
Together, those findings support what Tenable has been saying for years: The “patch everything” strategy is no longer viable. But the findings also leave critical questions unanswered. If organizations cannot patch everything, they need to know precisely where the greatest risk concentrates inside their own environments.
This post answers these questions:
- Which of the tens of thousands of active vulnerabilities do named adversaries actually exploit?
- How many organizations carry those specific exposures right now?
- What does the intersection of severity, active exploitation, and real-world exposure look like when you map it concretely?
Building the threat-exposure graph
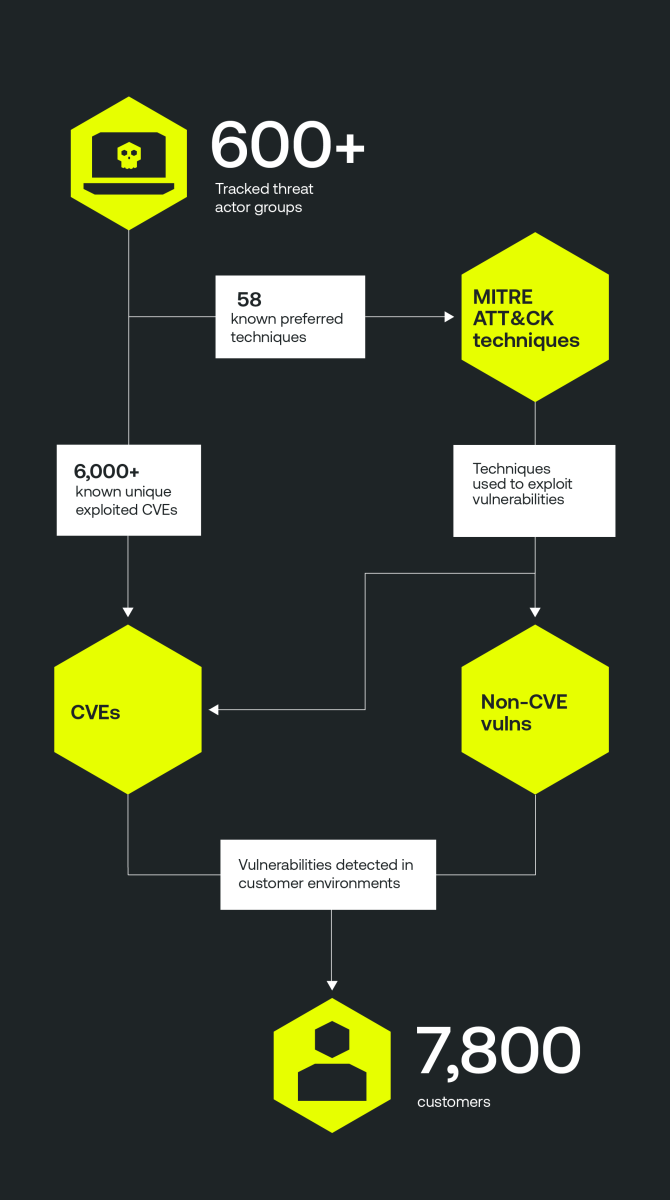
To move beyond per-CVE scoring into adversary-aware prioritization, Tenable Research built a directed graph model that links four categories of real-world entities: threat actors; the attack techniques they employ; the vulnerabilities those techniques exploit; and the customer environments where those vulnerabilities are actively detected.

A simplified view of the threat-exposure graph. The graph links four kinds of real-world entities: threat actors; the techniques they use; the vulnerabilities they exploit (both CVE and non-CVE); and the customers in whose environments vulnerabilities are detected . The graph also links them along the directions in which risk actually flows.
The customer base in this analysis comprises 7,800 U.S. and Canadian organizations actively monitored by Tenable’s vulnerability management products as of May 2026. Plugin-finding telemetry, indicating which CVE and non-CVE vulnerabilities are present in each environment, was joined to proprietary threat actor tracking data curated by Tenable’s Research Special Operations (RSO) team and publicly available MITRE ATT&CK technique data.
The graph tracks more than 600 named threat actor groups. Each has been documented either to directly exploit specific CVEs (more than 6,000 CVEs across all tracked groups) or to favor specific MITRE ATT&CK techniques (58 unique techniques observed).
Because techniques map to the CVEs and non-CVE weaknesses they are known to exploit, a named adversary can reach a customer environment along two routes: directly through an exploited vulnerability, or indirectly through a technique that exploits a weakness present in their environment.
This framework transforms the prioritization question from “how severe is this CVE?” into “which named adversaries can reach my environment through this CVE, and how many other organizations share that exposure?” That is a fundamentally different kind of intelligence that per-CVE scoring layers were never designed to provide.
- The Common Vulnerability Scoring System (CVSS) tells you how technically dangerous a vulnerability is.
- The Exploit Prediction Scoring System (EPSS) tells you how likely it is a threat actor will exploit it.
- The CISA KEV catalog tells you a bad actor has exploited it.
- Tenable's Vunerability Priority Rating (VPR) and Vulnerability Watch combine these signals with proprietary threat intelligence into a per-CVE priority recommendation.
All of these are valuable, but none tie the score to your specific asset inventory and the named adversary documented to exploit it.
Two important caveats before we present the findings:
- We are reporting exposure metrics, not breach predictions. When Tenable says a customer is “exposed” to a named adversary, we mean their environment contains one or more vulnerabilities that the threat actor has previously exploited or that aligns with the group’s documented technique profile. We are not predicting attacks or claiming breaches.
- All analyses represent scan windows beginning May 1, 2026. “Active” means at least one Tenable scan observed the vulnerability since that date. Customers may have patched between their last scan and publication.
Tenable findings
Vulnerabilities associated with tracked threat groups are pervasive
The prevalence data is sobering. Of the 7,800 organizations in this study, 5,333 (68%) have at least one active CVE that at least one named threat actor has previously exploited. That figure alone warrants attention, but the concentration is what makes it actionable: 3,517 organizations (45%) carry 25 or more such CVEs, and 653 (8%) carry more than 100.
The problem extends well beyond CVEs. A total of 4,686 organizations (60%) carry at least one active non-CVE vulnerability, such as a misconfiguration, weak credential, or end-of-life software exposure, that maps to an attack technique a tracked threat actor is known to prefer. These findings do not receive CVE identifiers, but they are operationally exploitable, and adversary playbooks routinely depend on them.
On the adversary side, 321 of the more than 600 tracked threat actors can reach at least one customer environment through an active vulnerability. This includes the ransomware operations that most security teams already track (Conti, Ryuk, RansomHub); nation-state operators with public attribution histories (Cozy Bear, Fancy Bear, Andariel, Volt Typhoon, Salt Typhoon); and well-documented APT clusters (APT1, FIN7, MuddyWater, Earth Lusca).
Organizations in this study likely have well-developed cybersecurity programs. Tenable provides them with detailed vulnerability prioritization data. They represent the more-prepared end of the spectrum of potential threat actor targets. The exposure picture for organizations with less mature security capabilities is, by any reasonable inference, significantly worse.
These are not low-priority vulnerabilities
The 6,000-plus distinct CVEs linked to threat groups in this study are dramatically over-represented in elevated VPR tiers compared to the full CVE population.
| VPR threshold | Threat group-associated CVE set | Proportion of all scored CVEs | Concentration ratio |
|---|---|---|---|
| ≥ 5 | 21.0% | 5.6% | 3.7× |
| ≥ 7 | 10.8% | 1.6% | 6.7× |
| ≥ 9 | 2.66% | 0.3% | ≈ 9× |
At the critical tier (VPR ≥ 9), CVEs associated with the study’s threat groups are nine times more concentrated than the global baseline. The persistence of these exposures is not primarily a failure of prioritization effort. Tenable data suggests the majority of customers in this study have significantly improved remediation rates for CVEs with VPR scores of 7 or higher over the past several years. Rather, continued persistence is further evidence of the central finding from the first two posts in this series: the flood of new vulnerabilities is outpacing even well-resourced organizations’ capacity to remediate.
The Elite Arsenal
If organizations cannot patch every threat group-associated vulnerability, where should they concentrate? Among the threat group-associated CVE set, 512 (8%) are listed in the CISA KEV catalog, an order of magnitude above the less-than-1% KEV share across the global CVE program. As the DBIR post documented, even KEV-listed vulnerabilities go unremediated in the majority of environments.
The intersection of Tenable’s critical VPR tier (VPR ≥ 9), the KEV catalog, and documented threat group exploitation gives us a tight shortlist: 242 CVEs that meet all three criteria simultaneously. We refer to this subset as the Elite Arsenal. Of the 242, all but one were actively detected in at least one organization's environment.
The age profile of the Elite Arsenal underscores why these exposures persist:
- More than half (53%) of Elite Arsenal CVEs are at least five years old.
- Nearly one in five (19%) are at least a decade old, with the oldest dating to 2009.
- The median age is five years.
These vulnerabilities represent a structural condition in which certain high-value CVEs become permanent fixtures of the attack surface, surviving years of remediation effort across thousands of organizations.
What makes that persistence especially dangerous is the breadth of adversaries exploiting them. Tenable Research has independently designated 54 of the 242 Elite Arsenal CVEs as “persistently exploited,” meaning they show sustained, multi-actor weaponization over years rather than months.
- Of those 54, state-sponsored APT groups have weaponized every single one.
- 98% have been incorporated into commodity malware delivery.
- 80% are exploited by ransomware operations.
- 78% are what Tenable calls “triple-weaponized”: simultaneously exploited by nation-state espionage actors, commodity malware operators, and ransomware gangs.
An organization carrying an unpatched Elite Arsenal CVE is exposed to all three at once.
The adversary concentration across these 54 CVEs is striking:
- The most prevalent nation-state actor, Salt Typhoon, appears in association with 12 of the 54.
- The most prevalent ransomware operation, Black Basta, appears across 15.
- Cobalt Strike, the most common offensive tool in the set, is documented across 20.
These are not isolated associations. They represent overlapping ecosystems of exploitation where the same vulnerability serves as an entry point for espionage, extortion, and financially motivated crime simultaneously. As the previous two posts in this series alluded to, the cyber attack landscape is rapidly evolving together with AI advancements. The widespread availability of frontier models means that mapping, chaining, and exploiting distinct attack paths has gotten substantially easier. Findings here indicate that far too many organizations still carry well-known Elite Arsenal CVEs in their environments that can act as relatively-easy exploit targets for AI-assisted attacks.
Prominent examples of widely-reported, multi-year fixtures in the Elite Arsenal include:
Network-edge devices:
- Citrix NetScaler ADC “Citrix Bleed” (CVE-2023-4966)
- Cisco IOS XE web UI privilege chain (CVE-2023-20198, CVE-2023-20273)
- Atlassian Confluence (CVE-2022-26134, CVE-2023-22515, CVE-2023-22518)
- F5 BIG-IP iControl REST (CVE-2022-1388)
- Palo Alto Networks PAN-OS (CVE-2024-0012, CVE-2024-3400)
- Ivanti Connect Secure VPN (CVE-2024-21887, CVE-2023-46805)
- ConnectWise ScreenConnect (CVE-2024-1708, CVE-2024-1709)
Endpoint and office:
- Microsoft Office remote code execution flaws (CVE-2017-0199, CVE-2017-11882)
- Windows kernel privilege escalations (CVE-2018-8453, CVE-2021-1732)
- Outlook NTLM credential leak (CVE-2023-23397)
- VMware vCenter (CVE-2023-34048)
- JetBrains TeamCity (CVE-2023-42793).
Domain and SMB:
- EternalBlue family (CVE-2017-0144, CVE-2017-0143, CVE-2017-0146)
- Zerologon (CVE-2020-1472)
- Sandworm/BlackEnergy (CVE-2014-4114).
Per-CVE remediation also misses the compound risk these vulnerabilities create when they coexist in the same environment. The Elite Arsenal contains several documented exploit chains where attackers use multiple CVEs in sequence to achieve objectives that no single vulnerability would permit.
- The ProxyLogon chain (CVE-2021-26855, CVE-2021-26857, CVE-2021-26858, CVE-2021-27065) gives attackers full Exchange Server control through four chained flaws.
- The Ivanti Connect Secure chain (CVE-2024-21887 with CVE-2023-46805) combines an authentication bypass with a command injection.
- FortiOS SSL-VPN credential theft (CVE-2018-13379) has been documented chaining directly into Zerologon (CVE-2020-1472) for full domain compromise.
Patching one link in these chains reduces risk, but patching all of them breaks the attack path entirely. Organizations that prioritize based on individual CVE scores alone may leave compound chains intact.
The 10 most prevalent Elite Arsenal CVEs, each detected in more than 2,000 customer environments, are:
- CVE-2013-3900 — WinVerifyTrust signature validation (3,027 environments)
- CVE-2026-21513
- CVE-2020-1472 — Zerologon
- CVE-2023-28252 — CLFS
- CVE-2023-32046 — Windows MSHTML
- CVE-2013-2465 — Java SE
- CVE-2023-36874 — Windows Error Reporting
- CVE-2025-41244
- CVE-2021-44228 — Log4Shell
- CVE-2022-30190 — Follina
The prevalence curve across the full 242 Elite Arsenal CVEs drops steeply (see chart below): The most prevalent CVE appears in more than 3,000 environments, while the long tail includes CVEs present in only a handful.
But the critical finding is that 241 of the 242 are active somewhere. Nearly every CVE that meets all three elite criteria is currently live in at least one monitored environment.
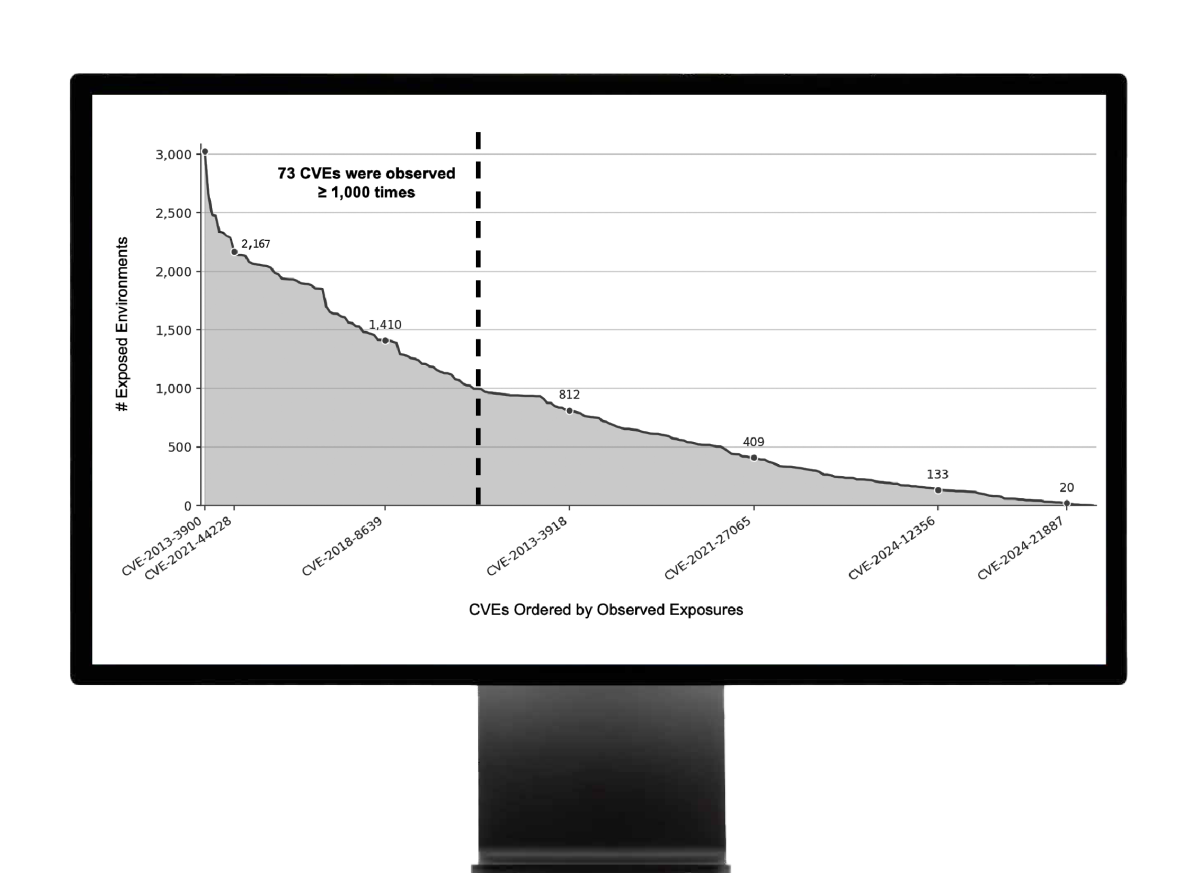
Elite Arsenal CVE set prevalence, May 2026. Each point on the curve is one of the 242 elite-criteria CVEs (critical VPR ≥ 9, listed in CISA KEV, and reachable from a tracked threat group), ordered from most to least prevalent across the studied organization base. The y-axis shows the number of organization environments where each CVE was actively detected.
While the Elite Arsenal is not typically reported as a distinct CVE set, we encourage organizations that cannot remediate all KEV vulnerabilities with VPR ≥ 9 to prioritize those appearing on Tenable's Vulnerability Watch list, at minimum. More than 52% of Elite Arsenal CVEs published since 2024 have appeared on Vulnerability Watch at least once. It is a resource that security teams can use to inform high-impact remediation decisions.
The non-CVE exposure surface
CVE-side prioritization works because CVEs are enumerated. Each gets a globally unique identifier, and every scoring framework in the industry is built on that identifier.
No analogous standardized infrastructure exists for non-CVE findings such as misconfigured Active Directory privileges, improper password management, unencrypted database connections, or exposed management interfaces. These items do not receive CVE numbers, VPR scores, or KEV catalog entries.
The lack of standard scoring for non-CVE findings is problematic because these findings are relevant to the attack surface. Across the customer base in this study, 7,769 organizations (effectively 100%) carry at least one actionable non-CVE finding, and 4,686 (60%) carry one that maps back to a tracked threat actor’s preferred techniques.
Roughly half of observed non-CVE findings are software misconfigurations, 15% are end-of-life software exposures, and the remainder are weak credentials, audit gaps, and policy gaps that adversary playbooks routinely depend on.
There is no Elite Arsenal equivalent for misconfigurations. But the graph model allows us to answer a useful question: Which non-CVE findings sit on a path that a tracked adversary’s technique profile is likely to walk? Based on that analysis, four principles should guide non-CVE prioritization today.
- Do not deprioritize non-CVE exposures simply because they lack a CVE number or a VPR score. Preliminary breach prediction modeling based on our graph suggests that non-CVE exposures may confer more data-breach risk than CVE-linked findings.
- Prioritize misconfigurations and end-of-life software first within the non-CVE bucket. Together, they account for 65% of actionable non-CVE findings, and end-of-life software is by definition unpatchable. Configuration drift and end-of-life inventory are among the most consistently exploited entry points in MITRE ATT&CK adversary playbooks.
- Use ATT&CK technique reachability as the prioritization axis. The 4,686 organizations carrying threat actor-mapped non-CVE findings are the non-CVE analogue of the customer set carrying Elite Arsenal CVEs. A misconfiguration that maps to a high-frequency technique threat actors use that’s active in your industry is operationally more urgent than a higher-volume but technique-unmapped finding.
- Recognize that non-CVE remediation is identity and configuration work, not patch work. Many of the non-CVE findings that appear in adversary playbooks, such as over-privileged service accounts, exposed management interfaces, weak authentication, and unmonitored privileged access, are addressed by tightening identity and configuration controls. The question shifts from “have we patched this?” to “have we hardened this?”
Tenable continues to invest in the scoring and prioritization infrastructure for the non-CVE surface, including the Tenable One Exposure Management Platform’s attack path analysis capabilities, which make adversary-technique reachability a first-class prioritization signal.
Closing the loop
The three blog posts in this series trace a single argument from macro- to micro-scale attack surface evaluations.
The volume crisis documented in “Why the Approaching Flood of Vulnerabilities Changes Everything” means the patch queue will keep growing. The remediation gap documented in “Key findings from the Verizon DBIR 2026” means organizations cannot work through that queue fast enough using traditional methods.
And the exposure data in this post shows the consequences of falling behind are measurable, attributable to specific adversaries, and concentrated in specific vulnerability sets that can be named and prioritized.
The data is unambiguous. Most of the 7,800 organizations in this study carry vulnerabilities that named threat actors have exploited. More than 200 critical, KEV-listed, threat group-associated CVEs are actively present across the customer base, many of them years old. And the non-CVE exposure surface, which receives far less attention than it deserves, is nearly universal and directly aligned with documented adversary techniques.
The prioritization question is no longer: “What is critical?” It is: “What is critical and likely to be exploited by threat groups that may target my industry, and is it actually present in my environment?”
Per-CVE scores alone cannot answer that question. The answer requires graph-based methods that link threat actor behavior to the specific weaknesses in your environment. Organizations that anchor their remediation programs to this kind of reachability-aware prioritization will spend their finite capacity on measurable risk reduction rather than chasing volume.
The intelligence, the platform, and the evidence base exist to make that shift today. The volume is not going to slow down. The remediation window is not going to widen. The adversaries are not going to wait. What you can control is where you focus.
The data and threat-exposure mapping methodology presented here represent the beginning of a broader effort to give organizations a clearer view of what adversaries can actually reach in their environments. Tenable is expanding our ability to capture and integrate threat actor intelligence into customer-facing prioritization, and we look forward to sharing more of that work in the months ahead.
Learn more about how Tenable One Exposure Management Platform helps organizations prioritize what matters in a world of accelerating vulnerability discovery.
如有侵权请联系:admin#unsafe.sh