Intro
While preparing for a workshop, we recently pondered the question: What if we ever need to extract runtime values from a live/dumped Python process?
There are multiple reasons one might want to do that:
- Debugging a production process: If a Python application is misbehaving in prod, it could be helpful to look at the state of certain objects. Attaching a proper debugger is often not feasible when the app is running in a container, because the container has restricted permissions. Attaching from the host side is also problematic if (system) package versions differ between host and container.
- Analyzing a malware process: Malware written in Python may have downloaded configuration data from a C2 server that is being held in memory. This is especially interesting if the C2 server is no longer responsive.
- Forensics: If law enforcement has obtained a memory snapshot of a threat actor’s system, there might be Python processes such as certain crypto wallets. Those processes contain data of interest (e.g., all transaction hashes).
When working with memory dumps, it’s generally pretty easy to find strings - especially if you have a rough idea of what you’re looking for.
But if you’re looking for other data such as ints, bytes values, or structured data containing a multitude of types, you’ll find yourself looking for a needle in a very big haystack.
What we need is an approach that is aware of Python interpreter internals and that can point the way to the exact data we’re looking for.
py-spy
py-spy by Ben Frederickson is an excellent tool for troubleshooting performance issues with Python applications.
It can record profiles (record), provide a live overview of which functions are taking up time (top), and display stack traces including args/locals for each frame (dump).
While it’s mostly designed for live processes, the dump feature also works for ELF core dumps.
One of the coolest parts is that you can run it on a container host and inspect arbitrary Python container processes, regardless of what version of Python is installed on the host.
We’ve used it countless times over the years to figure out what’s going on with hanging/deadlocked Python processes.
The tool is written in Rust and contains bindings for pretty much any Python version you may encounter, ranging from 2.7 up to the latest 3.14 at the time of writing. The bindings are auto-generated Rust code based on CPython structures for each specific version. This allows py-spy to get its bearings in process memory in order to correctly access interpreter state data.
As for how this is relevant to our goal: py-spy contains extensive logic for iterating over object attributes and formatting Python values (so it can print the locals in frames).
This is important, because after all, we can’t simply do str() or repr(), since we’re not running in the interpreter itself.
That makes the py-spy project a very good candidate for implementing our object introspection code.
All we need is a core dump in ELF format.
Obtaining core dumps
Just use gcore <pid>, right? No big deal.
Sadly, it’s not always that simple:
- Especially in LE contexts, shell access may be eschewed for reasons of stealthiness, meaning only a full memory snapshot is available (if we’re dealing with a virtualized system hosted somewhere).
- Some people run their Python apps on Windows (an unfortunate fact of life).
There doesn’t seem to be a tool that can “extract” a single process core dump from a full snapshot.
This is something that has often bothered me when working with Volatility:
You can use plugins like memmap to get a raw dump of process memory, along with a text or json file that maps virtual addresses to file offsets in the dump.
But no other/tool library can process those files; you either have to view them manually if you’re looking for something small/manageable, or write custom tooling that works with the json & dump file.
It would be great if Volatility could directly produce ELF core dumps. As it turns out, it doesn’t take much to create a minimal core dump file.

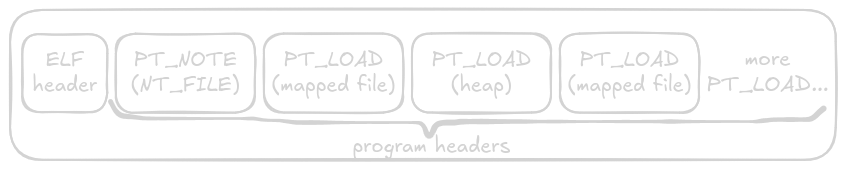
Figure 1 shows what parts are required in order to construct such a file.
We have the mandatory ELF header, which has its type set to ET_CORE (4), making this a core file.
The ELF file contains no sections, only program headers of different types.
There’s one PT_NOTE program header that contains filenames for each mapped module (the NT in NT_FILE is for note type, not Windows NT).
The rest of the program headers are of type PT_LOAD and contain the actual virtual memory pages, which can be contents of mapped files or arbitrary data pages such as heap/stack.
Volatility makes it pretty easy to populate those structures: You can iterate over pages belonging to a process and it will give you the start/end addresses, data, associated filename in case of a mapping, and permissions. In terms of ELF writing, the most finicky part is getting the note structures right, because they have specific alignment requirements.
Normally, core dumps would also contain thread state, detailing what values registers had at the time the dump was taken etc., but this is not at all trivial to obtain in our situation. When you ask the system to dump an individual process, the kernel prepares the process by freezing all of its threads and collecting all register values in a single place. We don’t have this luxury, because our system snapshot was taken at some arbitrary point in execution. Some threads might literally have been executing on a CPU core at that moment, and “plain” memory dumps don’t contain any sort of processor state. In any case, when using the dump in py-spy, this sort of information is not required.
Next, what do we do about Windows? Same thing, we put a Windows process into an ELF core dump! It’s admittedly a bit of a Frankensteinian solution that you would never encounter in the wild, but py-spy cannot parse Windows minidumps, and we didn’t feel like adding support for that. The Volatility plugins for Linux and Windows we ended up writing for this look remarkably similar, because concepts just aren’t that different between OSes at the level of abstraction we’re operating at. It’s called a VAD on Windows instead of a VMA on Linux, the page permission mapping is slightly different, and the filenames use backward slashes instead of forward slashes. But that’s about it.

Check it out in GDB (pretty hilarious if you ask me):
$ gdb --core=core.932.elf
#0  <unavailable> in ?? ()
(gdb) info proc mappings
Mapped address spaces:

          Start Addr           End Addr       Size     Offset objfile
       0x1caa4830000      0x1caa4841000    0x11000        0x0 \Windows\System32\C_437.NLS
       0x1caa47b0000      0x1caa47b3000     0x3000        0x0 \Windows\System32\l_intl.nls
       0x1caa4810000      0x1caa4821000    0x11000        0x0 \Windows\System32\C_1252.NLS
       0x1caa4940000      0x1caa4951000    0x11000        0x0 \Windows\System32\C_1252.NLS
       0x1caa4850000      0x1caa4853000     0x3000        0x0 \Windows\System32\l_intl.nls
       0x1caa4870000      0x1caa4939000    0xc9000        0x0 \Windows\System32\locale.nls
       0x1caa4960000      0x1caa4971000    0x11000        0x0 \Windows\System32\C_437.NLS
       0x1caa4a10000      0x1caa4a1f000     0xf000        0x0 \Program Files\Electrum\_internal\python3.dll
       0x1caa63f0000      0x1caa6538000   0x148000        0x0 \Windows\System32\en-US\KernelBase.dll.mui
...
You can then use the normal GDB commands like x to examine any virtual address of your choosing.
The dumps can also be read by libraries such as LIEF (C++/Python/Rust) and Goblin (Rust). py-spy happens to use Goblin internally. With some minor modifications to account for naming differences on Windows, py-spy can successfully display stack traces for our dump:
$ py-spy dump -c core.932.elf
Python v3.12.10

Thread 0
    ElectrumGui.main (electrum\gui\qt\__init__.py:602)
    Daemon.run_gui (electrum\daemon.py:674)
    handle_cmd (run_electrum.py:526)
    main (run_electrum.py:507)
    <module> (run_electrum.py:633)
Thread 0
    IocpProactor._poll (asyncio\windows_events.py:774)
    IocpProactor.select (asyncio\windows_events.py:445)
    BaseEventLoop._run_once (asyncio\base_events.py:1961)
    BaseEventLoop.run_forever (asyncio\base_events.py:645)
    ProactorEventLoop.run_forever (asyncio\windows_events.py:322)
    BaseEventLoop.run_until_complete (asyncio\base_events.py:678)
    create_and_start_event_loop.<locals>.run_event_loop (electrum\util.py:1683)
    Thread.run (threading.py:1012)
    setup_thread_excepthook.<locals>.init.<locals>.run_with_except_hook (electrum\util.py:1123)
    Thread._bootstrap_inner (threading.py:1075)
    Thread._bootstrap (threading.py:1032)
Thread 0
    Condition.wait (threading.py:359)
    Event.wait (threading.py:655)
    Plugins.run (electrum\plugin.py:796)
    setup_thread_excepthook.<locals>.init.<locals>.run_with_except_hook (electrum\util.py:1123)
    Thread._bootstrap_inner (threading.py:1075)
    Thread._bootstrap (threading.py:1032)
...
Side note for Windows: I recently learned that MemProcFS is able to produce minidumps for processes out of a system dump (thanks for the tip, Eddi!).
Iterating objects
Now that we have our data in a format that py-spy understands, we can get back to the original goal of looking at object data.
In Python, every object that could potentially be part of a reference cycle is tracked by the garbage collector (GC).
This includes container types like lists, dicts and sets, but also instances of user-defined classes.
We can use this to our advantage by inspecting the structures the GC uses to keep track of objects.
Essentially, we’ll be performing gc.get_objects(), just from the outside looking in.
py-spy is able to get the interpreter state object in order to facilitate its other features. In modern Python versions, this also happens to be where the GC state is kept.


As can be seen in Figure 2, the structures use flat composition - there’s no indirection going on.
The first time we encounter a pointer is when looking at the head structs embedded within each generation, which implement a cyclic doubly-linked list using next and prev pointers.
The layout looks like this from Python 3.9 through 3.13. In 3.14, there’s an inconsequential change where the generations array was shortened from 3 to 2 and an explicitly named young generation was introduced after the array.
In order to iterate over all registered objects, we simply iterate over each generation and follow the next pointers (yielding one GcHead every time), until next points back to the original generation head.
The GcHead structs are sort of glued in front of the actual tracked objects, so in order to get the object, we just add the size of GcHead to each next pointer and end up with a PyObject.
Neat!
Working with objects
With object instance pointers at hand, there are several things we can do with them:
- Call py-spy’s formatting logic on the object: For plain user-defined objects, this is pretty boring, since it will yield
<MyFoobar at 0x12345>. For built-in containers like lists and dicts, it will show their contents (as if you usedprint(mydict)in Python), which is already much more useful. - Iterate over the object’s attributes and format those in turn.
- Follow an attribute chain to get specific value(s), e.g.,
MainMalwareClass._c2_connector._port.
If we don’t want to get flooded by data, we might want to do some filtering based on the type first (e.g., restrict output to MainMalwareClass instances).
Each object has an ob_type member, which in turn has a tp_name string pointer, so getting this information is pretty straight-forward.
For accessing attributes, one can iterate over the object’s dict.
There are some aspects to keep in mind such as managed vs. non-managed dicts, but we won’t bore you with the technical details.
All of the low-level dict access plumbing is already implemented in py-spy via the DictIterator functionality.
Putting it into action (Imported_Wallet has an attribute adb of type AddressSynchronizer, which in turn has an attribute _history_local containing a dict with transaction histories):
$ py-spy objects -c core.932.elf --objectpath Imported_Wallet.adb._history_local
Found 1 object(s)
<Imported_Wallet at 0x1caaa82d8e0>:
{"1BgGZ9tcN4rm9KBzDn7KprQz87SZ26SAMH": {"fa02d09a9e9a193fc5b79b23e530c370c00e8e84e1bd543190604b02d171ad5b", "af70bb62aab453d13cbb3c4ca69fc22b71028fadebeecb5e6de036b62ada26c9", ...}}
(Note: The Bitcoin address shown here is one that has a publicly known private key.)
Another interesting thing you can do is print all dicts. This will obviously produce a pretty long output, but depending on your situation, it might yield things you didn’t think to look for.
$ py-spy objects -c core.932.elf --objectpath dict
# Some samples from the 16695 lines output:
{"sslcontext": <SSLContext at 0x1caaf52c150>, "peercert": {"subject": ((("countryName", "US")), (("stateOrProvinceName", "Ohio")), (("localityName", "Cloud"))), ...}, "cipher": (...), ...}
{"hosts": {"104.198.149.61": {"ssl_port": 50002, "tcp_port": 50001, "wss_port": 8443, "ws_port": 8000}, ...}, "pruning": None, "server_version": "ElectrumX 1.19.0", "protocol_min": "1.4", ...}
{"socket": <TransportSocket at 0x1cab00a68c0>, "sockname": ("10.0.2.15", 49702), "peername": ("168.119.33.233", 50002)}
{"socket": <TransportSocket at 0x1cab00a7730>, "sockname": ("10.0.2.15", 49705), "peername": ("104.198.149.61", 50002)}
{"txid": "9223da07e858c6f153fbb8a24db52374ca19d2639098207c71710610cfda808e", "amount_sat": 3000000, "fee_sat": None, "height": 215848, "confirmations": 731185, "timestamp": 1357732755, ...}
Conclusion
Managed/interpreted programming languages keep lots of metadata in their runtime out of necessity. We’ve shown in this post how to access data of interest in the case of Python by extending the capabilities of existing tools.
The additional constraint of sometimes only having full system memory dumps added further challenges. For future work, it would probably make sense to add minidump reading support to py-spy, because it’s unclear whether the Volatility maintainers will be willing to merge the Windows ELF creation plugin.
If you’re interested in the code changes discussed in this post, you can find the pull requests here: