2026-04-17
4 min read

When it comes to the Internet, performance is everything. Every millisecond shaved off a connection is a better experience for the real people using the applications and websites you build. That's why, at Cloudflare, we measure our performance constantly and share updates on a regular basis.
In our last performance post, published during Birthday Week 2025, we shared that Cloudflare was the fastest network in 40% of the largest 1,000 networks in the world. At the time, we noted a nuanced reading of that figure; we were competitive in many more networks, and the gaps were often notably small. But even so, we were not satisfied with 40%. By December 2025 (our most recent available analysis), we had become the fastest provider in 60% of the top networks. Here's how we got there, and what it means.
How do we measure and compare network performance?
Before diving into the results, let’s review how we collect the data. We start with the 1,000 largest networks in the world by estimated population, using APNIC's data as our source. These networks represent real users in nearly every geography, giving us a broad and meaningful picture of how Internet users experience the web.
To measure performance, we use TCP connection time, which is the time it takes for an end user's device to complete a TCP handshake with the endpoint they're trying to reach. We chose this metric because it most closely approximates what users actually perceive as "Internet speed." It's not so abstract that it ignores real-world constraints like congestion and distance, but it's precise enough to give us actionable data. (We've previously written about why we favor this metric over alternatives.)
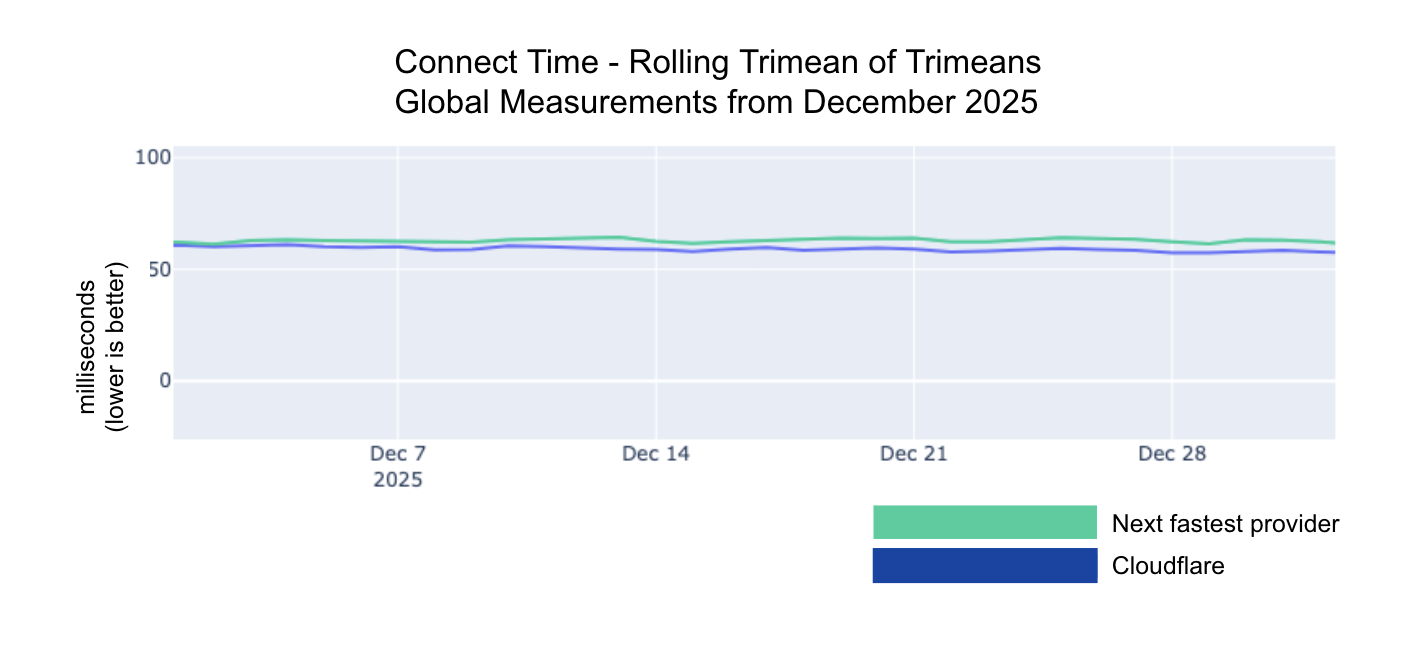
We calculate our rankings using the trimean of TCP connection times. The trimean is a weighted average of three values: the first quartile (25th percentile), the median (50th percentile), and the third quartile (75th percentile). This approach smooths out noise and outliers, giving us a cleaner signal about the typical user experience rather than an extreme case that might skew the picture.
To capture this data, we rely on Real User Measurements (RUM). When users encounter a Cloudflare-branded error page, a small speed test runs silently in the background. The browser retrieves small files from multiple providers including Cloudflare, Amazon CloudFront, Google, Fastly, and Akamai and records how long each exchange takes. This gives us performance data directly from the user's browser, in their real-world network conditions. It's the difference between testing a car's top speed on a track versus watching how people actually drive on the highway.
How did we improve?
Historically we have shared how we’ve created new Cloudflare points of presence and reduced our end latency by simply getting more hardware closer to our users. Most recently, we deployed new locations in Constantine, Algeria; Malang, Indonesia; and Wroclaw, Poland. When we deployed our location in Wroclaw, our free users went from an average of 19ms round-trip time (RTT) to an average of 12ms round trip time (RTT), a 40% improvement. In Malang, Enterprise traffic went from a 39ms average RTT to a 37ms average RTT, a 5% improvement. Seeing our customers' experience improve, even if only by a couple of milliseconds, is great. But adding new locations alone doesn’t fully explain how we went from being #1 in 40% of networks to #1 in 60% of networks.
The answer there has to do with improving how our network handles connections in software. By leveraging protocols like HTTP/3 and changing how we manage congestion windows, we can reduce processing time by milliseconds in code, in addition to the improvements on the wire. By improving CPU usage and memory usage in our software that handles fundamental actions like establishing connections, SSL/TLS termination, traffic management, and the core proxy that all requests flow through, we can make that software more efficient in its usage of resources across our global fleet of hardware. These ongoing efficiency gains result in better performance for you and your customers.
Think of incoming connections to Cloudflare like toll booths on a highway. Lines can build up at toll booths if there aren’t enough toll booths, or if the booths themselves aren’t efficient at processing cars going through them. We’ve been constantly working to improve not only how our toll booths process incoming cars (the software improvements in connection handling), but also at improving how we send cars between available booths so that we can keep lines short and latency low.
How do the results look today?
As we noted above, by December, Cloudflare had become the fastest provider in 60% of the top networks, up from 40% when we last reported. Since Birthday Week in September 2025 we have steadily increased the networks where we are the fastest. Let’s break down the impact.


This means that between September and December, we became the fastest in 40 additional countries and in 261 additional networks. We saw the biggest increase in the United States, where we are the fastest in 54 more ASNs.

On average throughout December, we were 6ms faster than the next-fastest provider. As shown above, the line representing Cloudflare’s latency, or connection time, is consistently lower throughout December than the next fastest provider.
A faster Internet is a better Internet
Every percentage point in our network ranking represents real users who are able to connect to their website or application that much faster because of Cloudflare. But we also know that 60% isn't the ceiling. There are still networks where we're number two, sometimes by the smallest of margins. We see those gaps clearly, and we're working on them. We're committed to being the fastest provider across every network in the world.
Follow our blog for more performance updates as we continue to make the Internet faster.
Cloudflare's connectivity cloud protects entire corporate networks, helps customers build Internet-scale applications efficiently, accelerates any website or Internet application, wards off DDoS attacks, keeps hackers at bay, and can help you on your journey to Zero Trust.
Visit 1.1.1.1 from any device to get started with our free app that makes your Internet faster and safer.
To learn more about our mission to help build a better Internet, start here. If you're looking for a new career direction, check out our open positions.