
好的,我现在需要帮用户总结一篇文章,控制在100字以内,而且不需要特定的开头。首先,我得仔细阅读文章内容,理解主要信息。 文章主要讲的是ProjectDiscovery开发的Neo平台如何通过提示缓存优化LLM成本。他们最初面临高昂的LLM费用,通过实施提示缓存,成本节省显著提升,达到了70%。文章详细介绍了他们如何设计三个断点和重定位技巧来提高缓存命中率。 接下来,我需要提炼这些关键点:Neo平台、多智能体工作流、LLM优化、提示缓存、成本节省。确保在100字以内准确传达这些信息。 可能会遇到的问题是如何简洁地表达技术细节而不遗漏关键点。需要确保语言流畅且信息完整。 最后,检查字数是否符合要求,并确保总结准确反映了原文的核心内容。 </think> ProjectDiscovery的Neo平台通过优化LLM提示缓存技术,在多智能体安全测试中实现了高达70%的成本节省。该技术通过三个断点和动态内容重定位显著提升了缓存命中率,使复杂任务的成本大幅降低。 2026-4-10 02:42:6 Author: projectdiscovery.io(查看原文) 阅读量:18 收藏
At ProjectDiscovery, we've been building Neo, an autonomous security testing platform that runs multi-agent, multi-step workflows, routinely executing 20-40+ LLM steps per task. Vulnerability assessments, code reviews, and security audits at scale, enabling continuous testing across the entire development lifecycle.
When we launched, our LLM costs were staggering. A single complex task with Opus 4.5 could consume 60 million tokens. Then we implemented prompt caching. Here's what changed:
| Metric | Before | After |
|---|---|---|
| Cache hit rate | 7% | 84% |
| Overall cost savings | baseline | -59% |
| Post-optimization savings (since Feb 16) | baseline | -66% |
| Last 10 days | baseline | -70% |
| Tokens served from cache | - | 9.8 billion |
Why prompt caching is critical for complex security tasks
Traditional chatbot interactions are 1-2 turns. You send a message, you get a response. The system prompt is maybe 500 tokens. Agentic systems are fundamentally different.
Take a realistic security task: scan a target's attack surface, identify exposed services, fingerprint technologies, cross-reference known CVEs, attempt exploitation paths, and produce a structured report. That's not one prompt. That's a coordinated sequence of decisions, tool calls, and intermediate findings, each building on the last.
Neo's average task runs 26 steps with 40 tool calls. System prompts are 2,500+ lines of YAML, over 20K tokens per agent. Each step re-sends the entire conversation: system prompt, tool definitions, and all prior messages. Multi-agent architectures multiply this further; our agent swarm prompt alone is 2,547 lines. Without caching, every step pays full price for the entire prefix. On a 40-step task, you're sending that 20K-token system prompt 40 times. And as the conversation grows linearly, step N re-sends everything from steps 1 through N-1.
The agentic tax: the cost of intelligence compounds quadratically with task complexity. Caching is the only structural fix.
Overall, caching saved 59% on LLM costs compared to what the same token volume would have cost at full input rates. Post-optimization that number is 66%, and the last 10 days are at 70%. These figures come from actual reported costs, not estimated pricing - we derive the effective per-token rate from real spend, then compare it against what that same volume would have cost if every input token was charged at the standard rate instead of 10% for cached reads.
The architecture: three breakpoints and a relocation
Anthropic's prompt caching works by marking stable prefixes with cache_control markers. When a prefix matches a previous request, those tokens are served from cache instead of reprocessed. You get up to 4 breakpoints per request. We use three, and we had to invent a relocation trick to make them work properly.
Breakpoint 1: static system prompt (BP1)
The first breakpoint marks the last static system message - the core agent instructions that don't change between users, threads, or requests. The key decision here was using a 1-hour TTL instead of the default 5 minutes. This keeps the system prompt cache alive across users and tasks. When multiple concurrent tasks are running the same agent type, the prefix stays warm continuously during business hours.
Breakpoint 3: tool definitions (BP3)
We cover BP3 before BP2 because the order matters for understanding the architecture. BP3 marks the last static tool definition. Tools are sorted so static tools come first; dynamic per-user subagents come last. This creates a shared cache chain - [system prompt -> BP1] [static tools -> BP3] - that is identical across all users and cached for an hour.
Breakpoint 2: conversation sliding window (BP2)
BP2 marks the last tool result in the conversation, creating a sliding window where each new step only pays for messages added since the last breakpoint. It uses a 5-minute TTL because conversation state is per-session and changes rapidly.
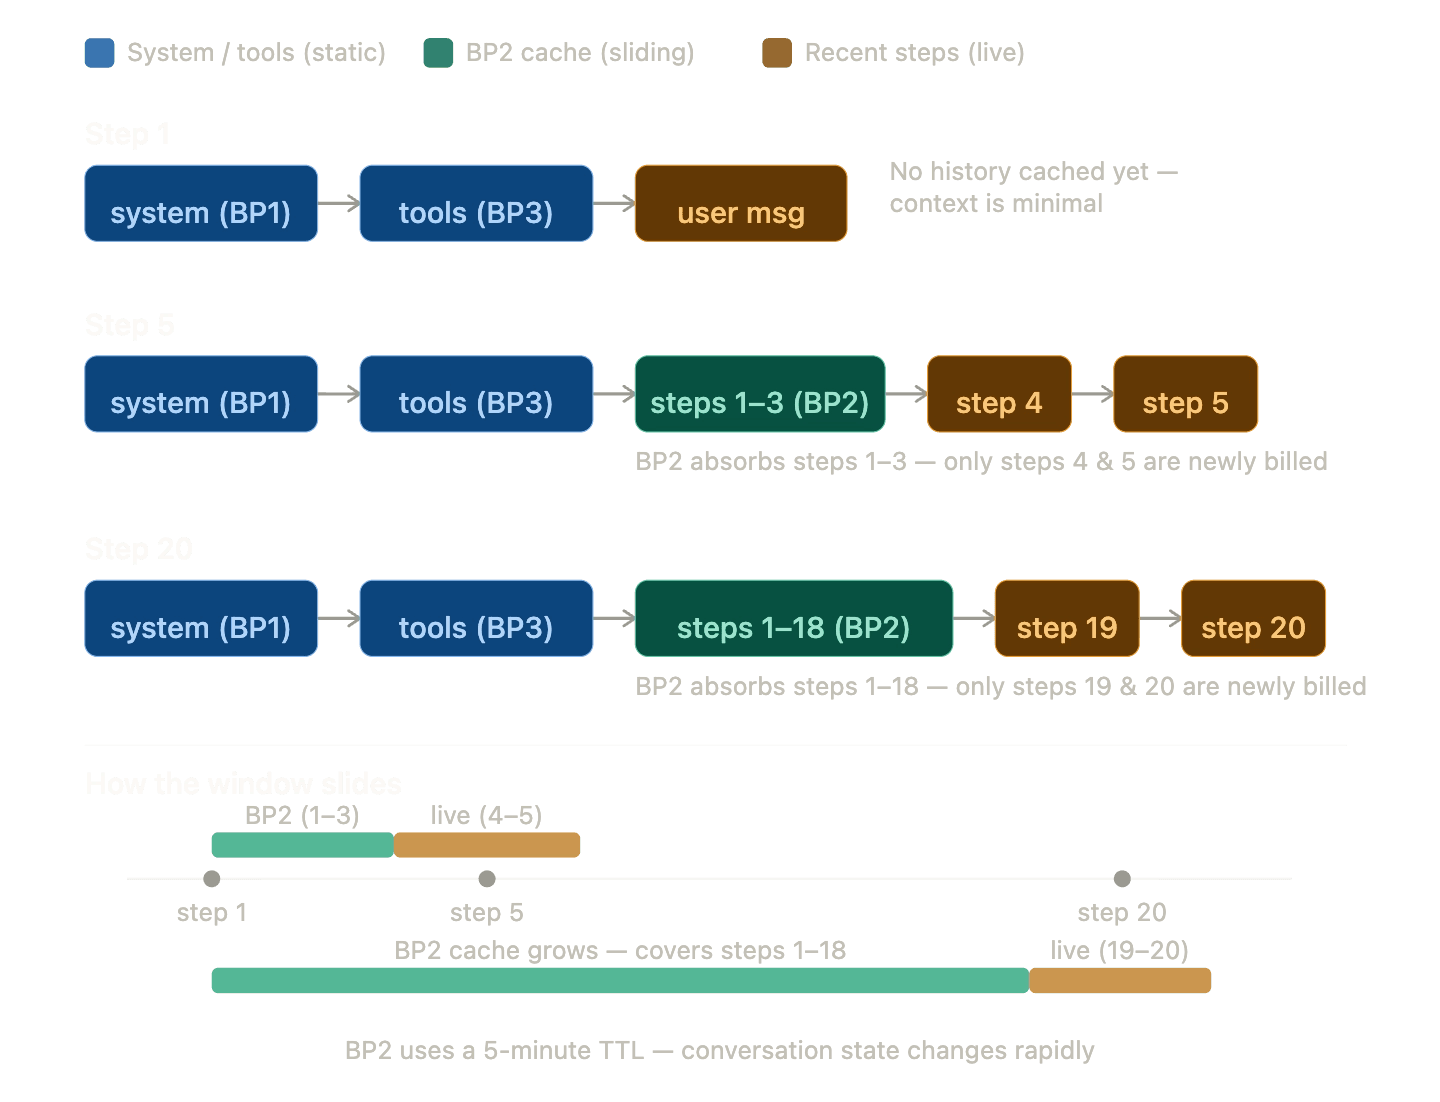
Only the blocks to the right of the last BP2 marker are reprocessed each step. Everything else is served from cache.
Anthropic has a documented caveat: if your prompt has more than 20 content blocks before a cache breakpoint and you modify content earlier than those 20 blocks, you won't get a cache hit. We handle this with intermediate breakpoints every 18 blocks, which supports up to 54 content blocks - roughly 18 to 27 agent steps - before degrading to partial caching.
The relocation trick: moving dynamic content out of the prefix
This was our single most impactful optimization. Anthropic's cache is strictly prefix-based - anything that changes in the middle of the prefix invalidates everything after it. Our original structure had working memory, skills context, and runtime context sitting between BP1 and BP3. Working memory changes on nearly every step. This was silently killing our cache hits.
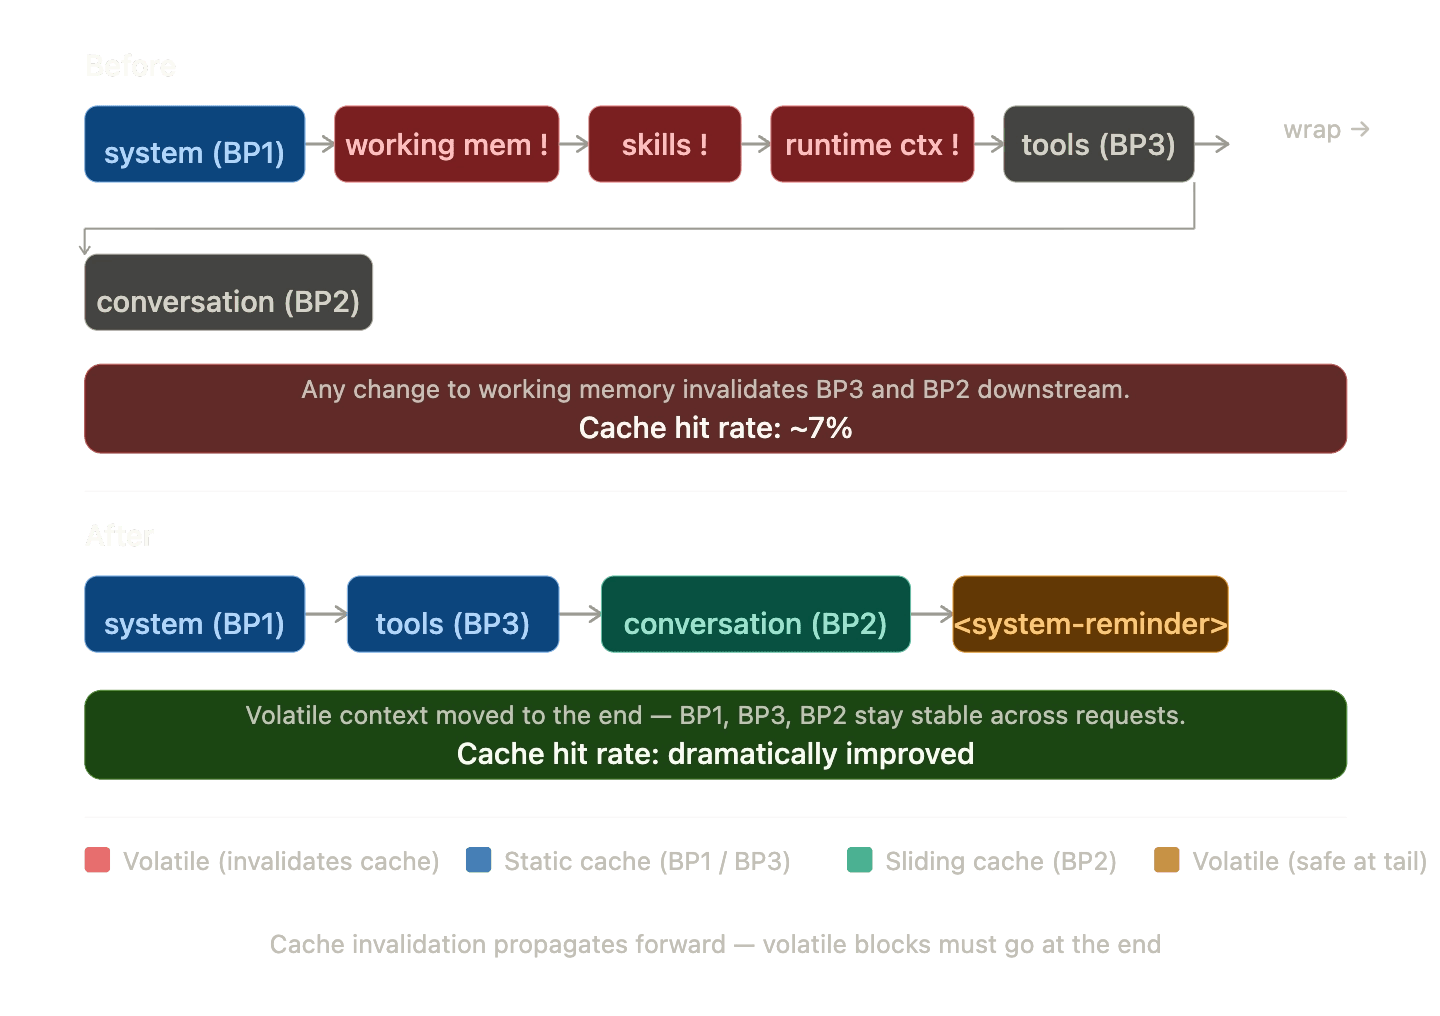
Dynamic content appended as a user message at the tail. Changes only affect the final block. Cache hit rate: ~74%.
The smaller optimizations that pushed us from 74% to 84%
Stable template variables
Our system prompts are YAML templates with variables like {{current_datetime}}, {{env_vars_list}}, and {{task_workspace}}. Rendering these with actual values would give every user a unique system prompt, destroying cross-user cache sharing at BP1. We render templates with stable placeholders instead. The actual values arrive via Runtime Context at the wire level through the relocation trick above.
Frozen datetime
We freeze the datetime once per task run and format it as date-only - no clock time. Including the current time would change Runtime Context every second, causing cache misses on the tail. Date-only keeps it stable for an entire day.
Provider routing for cache locality
Anthropic caches are provider-specific. A request hitting Anthropic Direct and a follow-up hitting Amazon Bedrock won't share caches even if the prompts are identical. We route all traffic to Anthropic Direct first and fall back to Bedrock and Vertex only during outages. That keeps the cache pool shared across the whole user base.
Tool message part-level marking
When an agent makes parallel tool calls, the SDK fans each tool response into a separate wire message. Marking the tool message with cache_control causes every wire message to inherit it - potentially exhausting all 4 breakpoint slots from a single mark. We mark only the last content part of the last tool message: one breakpoint consumed instead of N.
The data: from 7% to 84%
The week of Feb 16 is when we shipped the relocation trick and three-breakpoint architecture. Cache rate jumped from under 8% to 74% overnight. Everything after that was incremental.
| Week starting | Streams | Cache rate | Notes |
|---|---|---|---|
| Feb 2 | 955 | 4.2% | |
| Feb 9 | 1,186 | 7.6% | |
| Feb 16 | 1,384 | 73.7% | relocation shipped |
| Feb 23 | 1,497 | 78.2% | |
| Mar 2 | 1,347 | 77.4% | |
| Mar 9 | 1,309 | 80.2% | |
| Mar 16 | 1,126 | 84.3% | |
| Mar 23 | 975 | 85.0% | |
| Mar 30 | 666 | 82.9% |
Cache rate scales with task complexity
The more steps a task takes, the higher the cache rate. This matters because caching disproportionately helps the most expensive tasks - which is exactly the cost curve you want.
| Steps | Streams | Avg cache rate | Avg input tokens |
|---|---|---|---|
| 1 | 2,801 | 35.5% | 47,518 |
| 2-3 | 794 | 30.0% | 161,442 |
| 4-5 | 620 | 42.8% | 253,880 |
| 6-10 | 1,284 | 53.6% | 379,818 |
| 11-20 | 1,729 | 63.9% | 745,685 |
| 20+ | 3,139 | 74.0% | 3,763,263 |
The single-step dip to 35% makes sense: there's no conversation history to cache yet, so only BP1 contributes. By step 20+, BP2's sliding window is doing the heavy lifting across 3.7 million-token inputs.
What it looks like at extreme scale
| Task | Model | Input tokens | Cache rate | Steps |
|---|---|---|---|---|
| c790f4... | Opus 4.5 | 67.5M | 91.8% | 1,225 |
| a78a99... | Opus 4.5 | 57.5M | 92.9% | 1,663 |
| 8c42b5... | Opus 4.5 | 57.2M | 83.2% | 1,428 |
| 0935514e... | Opus 4.5 | 66.8M | 3.2% | - |
Task c790f4 ran 67.5 million input tokens across 1,225 steps at 91.8% cache rate. Compare that with 0935514e: nearly identical token volume, 3.2% cache rate, roughly 60x the cost. The latter ran before the optimization rollout.
A note on Anthropic's automatic caching
Anthropic recently released automatic prompt caching, a great addition that handles breakpoint placement without any cache_control markers in your code. For many use cases, it's a solid starting point that removes a lot of the manual work.
For an agentic system like Neo, though, we needed more control. Automatic caching has no awareness of which parts of your prompt are stable versus dynamic. In Neo's case, working memory, runtime context, and per-user variables sit in the middle of the prompt and change on every step, which leads to consistent cache misses on exactly the content that benefits most from caching.
TTL control is the other piece. For shared static content like system prompts, a 1-hour TTL is what keeps the cache warm across users and tasks. Without it, a cold start every 5 minutes on a busy platform means a significant fraction of requests become cache writes rather than reads, and cache writes cost more than standard input tokens.
Automatic caching is a smart default that Anthropic has made easy to adopt. Neo's scale and complexity required going further with explicit breakpoint placement and deliberate TTLs, which is what took us from single-digit hit rates to 84%.
What we learned
- Prompt caching is not optional for agentic systems. If your agents run more than 3-5 steps, you're leaving significant money on the table. Multi-step tasks are both the most expensive and the most cacheable - the ROI here is better than anywhere else in the stack.
- The relocation trick was our biggest win. Moving dynamic content out of the cacheable prefix took our rate from 7% to 74% in a single deployment. If you're seeing low cache rates, this is almost certainly the cause.
- Cross-user cache sharing is a force multiplier. When multiple users run the same agent type, they share the same system prompt cache via stable templates and a 1h TTL. The cache stays warm permanently during business hours. Single-user systems on 5m TTL will see much lower rates.
- Measure at the right granularity. Our 69% overall rate obscures the real story: 84% for the last 10 days, 90%+ for tasks on the fully optimized path. Per-stream metrics are essential. Aggregate rates will mislead you.
- The 4-breakpoint limit is a real constraint. Parallel tool calls, intermediate conversation breakpoints, and the system prompt all compete for 4 slots. Understanding the wire-level behavior of your SDK matters more here than the API documentation alone.
- Cache rate naturally improves with task complexity. More steps means more conversation to cache means higher hit rate. The architecture compounds in your favor as tasks get longer.
- Extended thinking and caching don't mix well across providers. If you're running multi-provider, disable extended thinking in caching-critical paths for now. Anthropic Direct handles it cleanly, but Bedrock, Vertex, and older model versions each fail differently, and none of it is documented.
Better caching means tasks cost less to run
Every percentage point improvement in cache hit rate reduces what it costs to run a task through Neo. Going from 7% to 84% means that the most complex security audits, the ones that used to be orders of magnitude more expensive per run, are now economically viable to run repeatedly. And because those savings flow directly to the teams using Neo, what was once a one-off assessment can now become a continuous part of how security work gets done, at scale, for organizations that can't afford to slow down.
If you're building an agentic platform and haven't prioritized prompt caching yet, start here. It's the highest-ROI infrastructure change we've shipped.
If you want to see what Neo can do for your security workflows, request a demo.
Further reading
- Prompt caching — Anthropic's official reference for
cache_controlsyntax, TTL behavior, breakpoint limits, and supported models. - Building effective agents — Anthropic's guide to multi-step agentic architectures: the distinction between workflows and agents, when to use each, and patterns seen in production.
Neo is ProjectDiscovery's autonomous security testing platform. This is the first post in our engineering blog series covering the technical decisions behind Neo.
如有侵权请联系:admin#unsafe.sh