Escape工具重新设计了动态安全测试工具在Web应用和API上的覆盖范围展示方式,使每个执行动作可观察、验证和解释。新增功能包括API覆盖页面、攻击路径验证图、截图验证、统一日志页面等,帮助用户全面了解测试过程、验证覆盖范围并快速诊断问题。 2026-1-19 17:53:37 Author: securityboulevard.com(查看原文) 阅读量:0 收藏
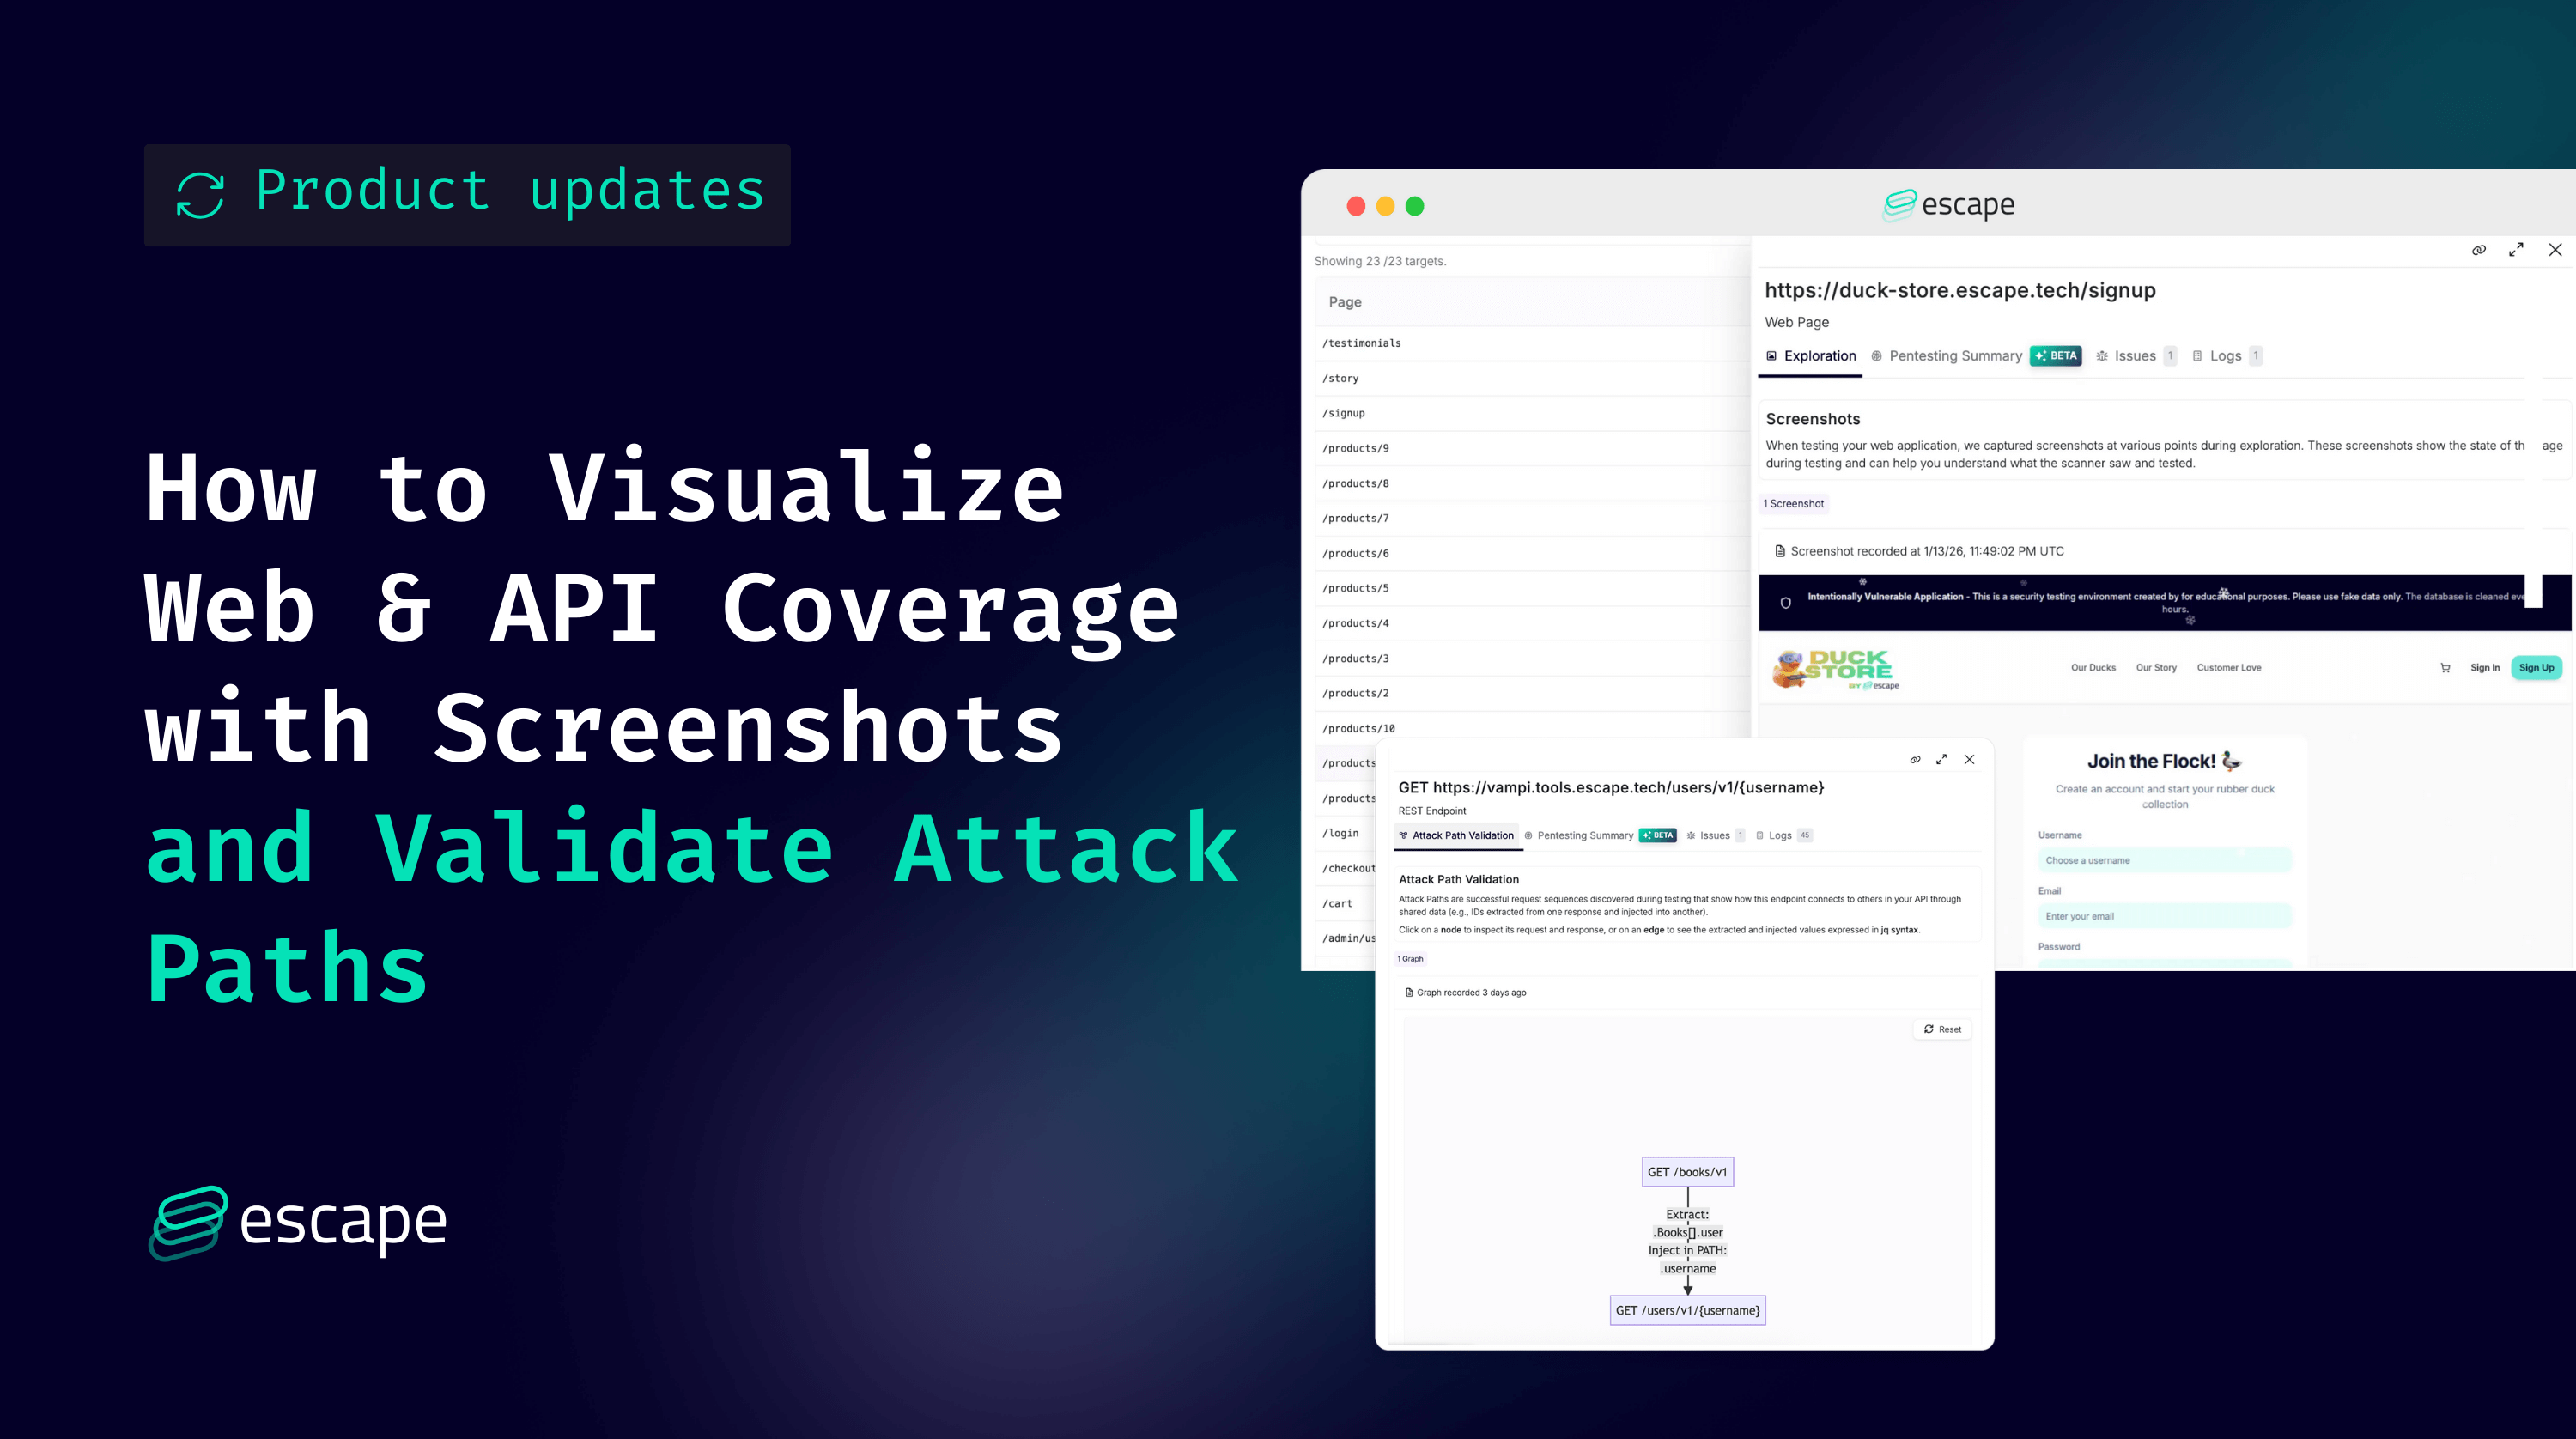
We reworked how Escape represents dynamic security testing tool coverage across web applications and APIs, with one goal:
Make every executed action observable, verifiable, and explainable. We strongly believe every app is different, and just showing visited URLs is not enough.
Why this matters
After every security scan, you might be left wondering: "Did it actually test our admin endpoints? How did it reach that nested API call? Why didn't it find the vulnerability our pentester discovered?" When auditors, developers, or leadership ask for proof of thorough testing, you're stuck with a vulnerability report and a shrug.
Now, we help your team to answer the following questions:
- Is the scanner getting good broad coverage?
- What endpoints were actually tested?
- Did authentication succeed, and where did it fail?
- How were inputs discovered and chained?
- Which attack paths succeeded, failed, or were blocked?
This update makes Escape’s exploration and testing fully transparent, end-to-end. You can prove what was tested, troubleshoot gaps instantly, and stop defending your security tooling.
What’s Included For APIs (At a Glance)
- API Coverage page showing all API endpoints actually visited during a scan
- Advanced filtering by endpoint, severity, method / mutation type, and coverage status
- HTTP status code visualization to quickly spot error-heavy or unreachable routes
- Attack Path Validation graph that gives you visibility into Escape’s API exploration engine and helps you ensure that everything found by Escape is interpreted in the correct way and that all the input is valid.
- Pentesting Summary (Beta) explaining the endpoint's purpose and what vulnerabilities were found on that endpoint
- New Logs page with a full, filterable execution trace of the scan
What’s Included For Web Applications (At Glance)
- Web Application Coverage showing all tested pages and states
- Screenshots captured during exploration, including dynamic SPA states
- Search and filtering to validate that specific routes were tested
- Dedicated Crawling view listing all discovered pages in a folder-based structure
- API Coverage for web-triggered API calls, with the same attack path validation graphs and visibility as API-first scans
- Unified Logs page shared across web and API testing for full end-to-end traceability
Yes, you can now get full visibility into everything executed during a scan and truly check whether Escape is testing your applications and APIs appropriately.
Find more details on each point below.
Coverage & Attack Path Validation For API Testing
API Coverage Page: Proving What Was Actually Tested
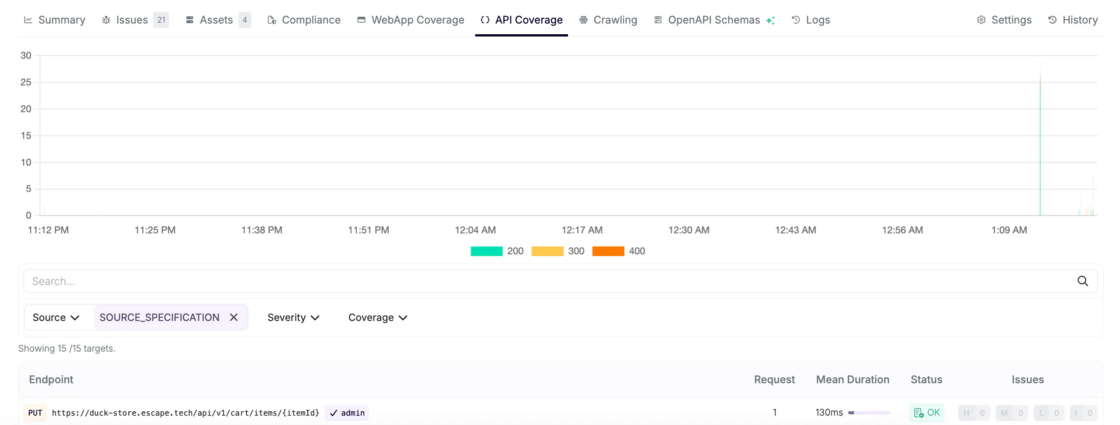
The API Coverage page shows every API endpoint visited by the crawler, allowing you to quickly confirm that sensitive routes were actually exercised.
You can:
- Search for a specific endpoint or resolver
- Confirm whether it was tested
- Immediately see if testing succeeded, partially failed, or was blocked
This lets you answer, with certainty:
Was this endpoint actually exercised during the scan?
You can narrow the list of endpoints by:
- Associated vulnerability severity→ focus on endpoints involved in high-impact findings
- Associated HTTP method (REST) or mutation type (GraphQL)→ understand how an endpoint was interacted with
- Coverage status→ OK, server error, timeout, unreachable, etc.
This is especially useful to:
- Identify endpoints that consistently error out
- Spot routes that were reachable but never returned valid responses
- Understand where configuration issues prevented deeper testing
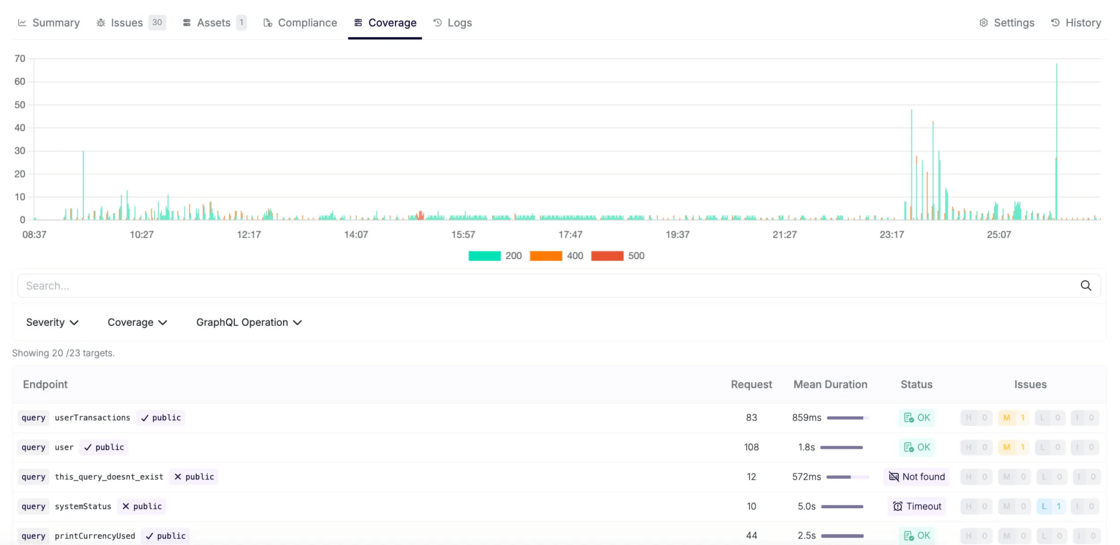
At the top of the page, Escape visualizes HTTP status codes (200 / 400 / 500 …) in a stacked bar chart. This gives you a fast signal for questions like “Are a large number of endpoints returning 400 or 500?”
Attack Path Validation Graphs: Verify that interpreted in the correct way
The coverage page tells you what was reached. Attack Path Validation Graphs show how it was reached, including the initial input. For each endpoint, you can open an Attack Path Validation Graph that exposes the exact execution chain used by Escape to get there.
💡
These graphs help you to understand complete request sequence generated by Escape’s Business Logic Security Testing (BLST) algorithm, an intelligent engine built by the our research team that understands dependencies, extracts dynamic values, and chains requests like an experienced pentester.
What the Graph Shows (Precisely)
Each graph represents:
- The sequence of requests and responses
- Dependencies between endpoints
- Data extraction and reinjection logic used to build valid requests
Extractions and reinjections between different requests are described using jq syntax.
Example (REST API): Chaining Endpoints the Way an Attacker Would
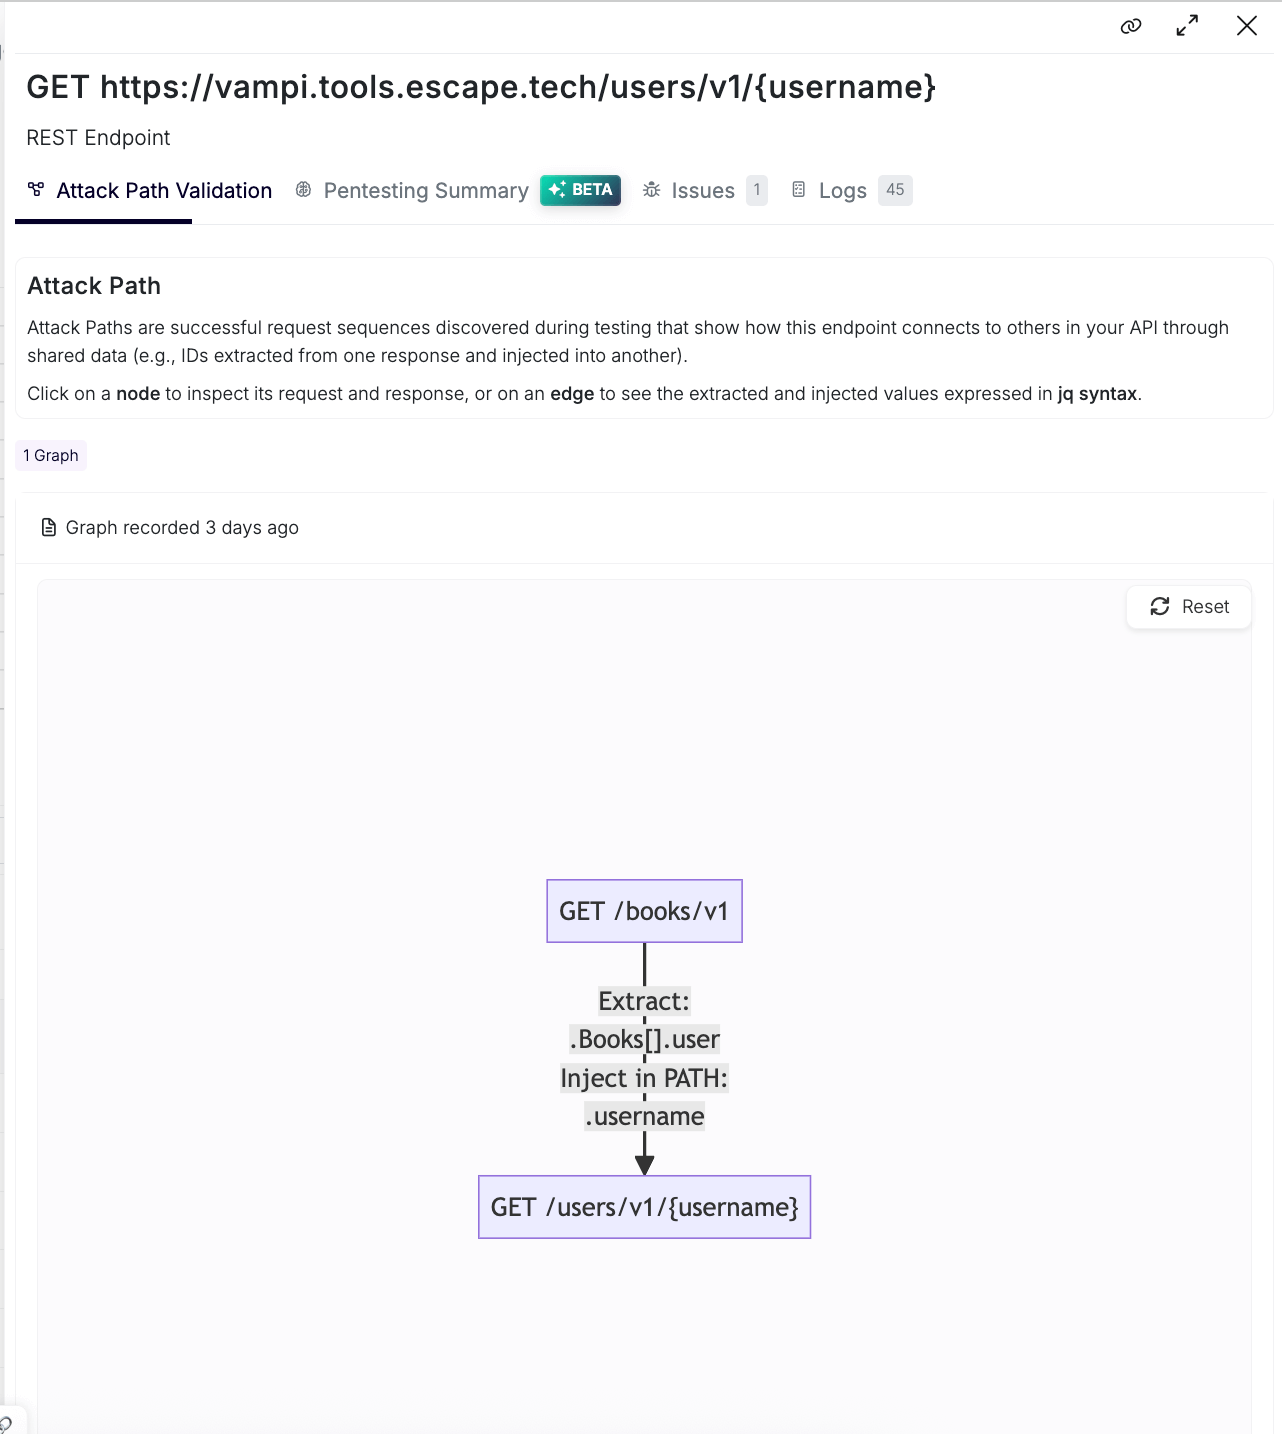
Imagine an API exposing:
GET /books/v1→ returns a list of books and associateduser_idGET /users/v1/{user_id}→ returns user details
During exploration:
- Escape calls
GET /books/v1 - Extracts
user_idvalues from the response - Reinserts those IDs into
GET /users/v1/{user_id}
In the Attack Path Validation Graph, you can see:
- Where the ID came from
- How it was validated
- Which follow-up requests succeeded or failed
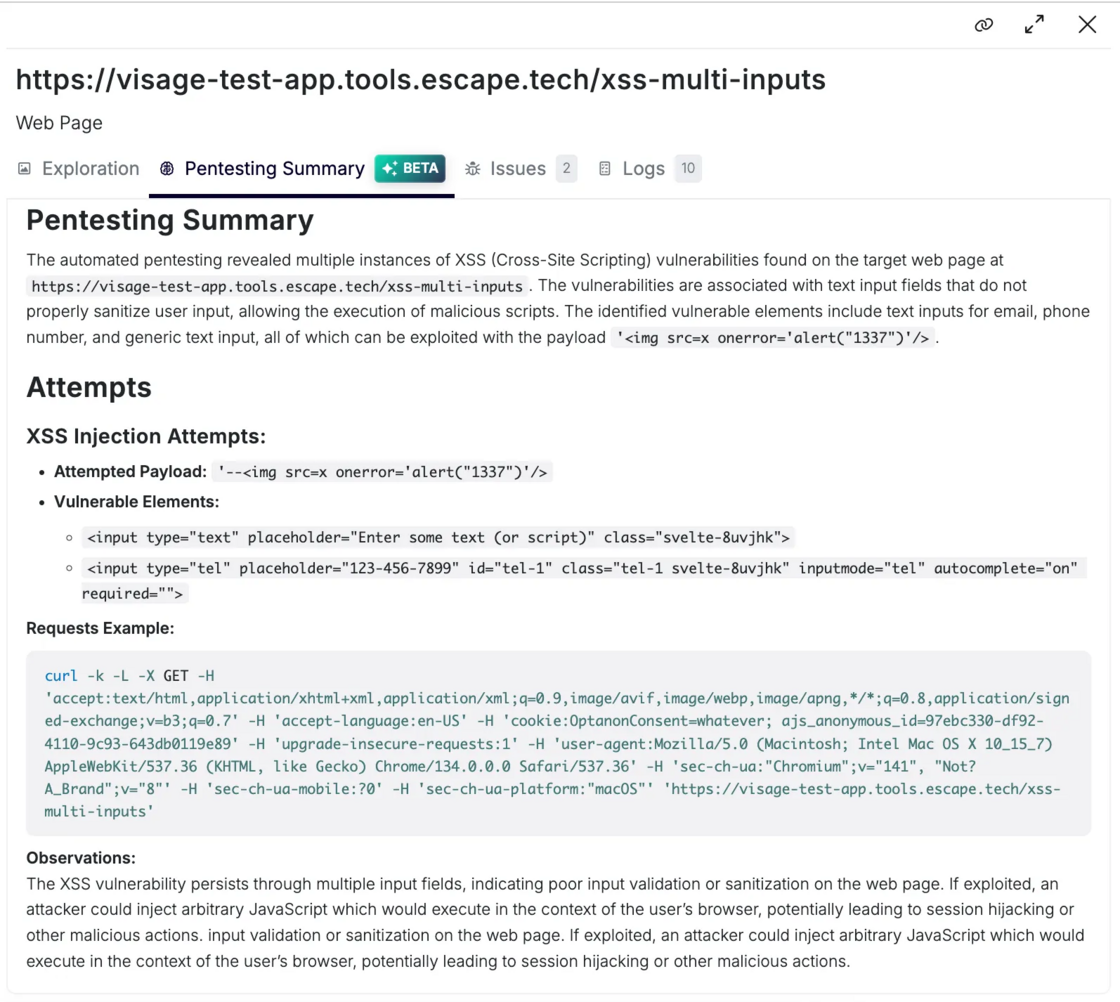
Pentesting Summary (Beta)
To complement raw execution data, Escape adds AI pentesting summaries per endpoint.
Exploration Summary (Beta)
This explains the endpoint's purpose, business logic, how it was discovered, and which execution path led to it. It is particularly useful for reviews, knowledge transfer, audits.
Pentesting Summary (Beta)
This section focuses on security impact and provides explanations:
- What vulnerabilities were found
- Which payloads triggered them
- Why the behavior is exploitable
- What an attacker could realistically do
It connects findings directly to execution evidence.
To get access to the AI pentesting summary feature, reach out to your dedicated Escape contact.
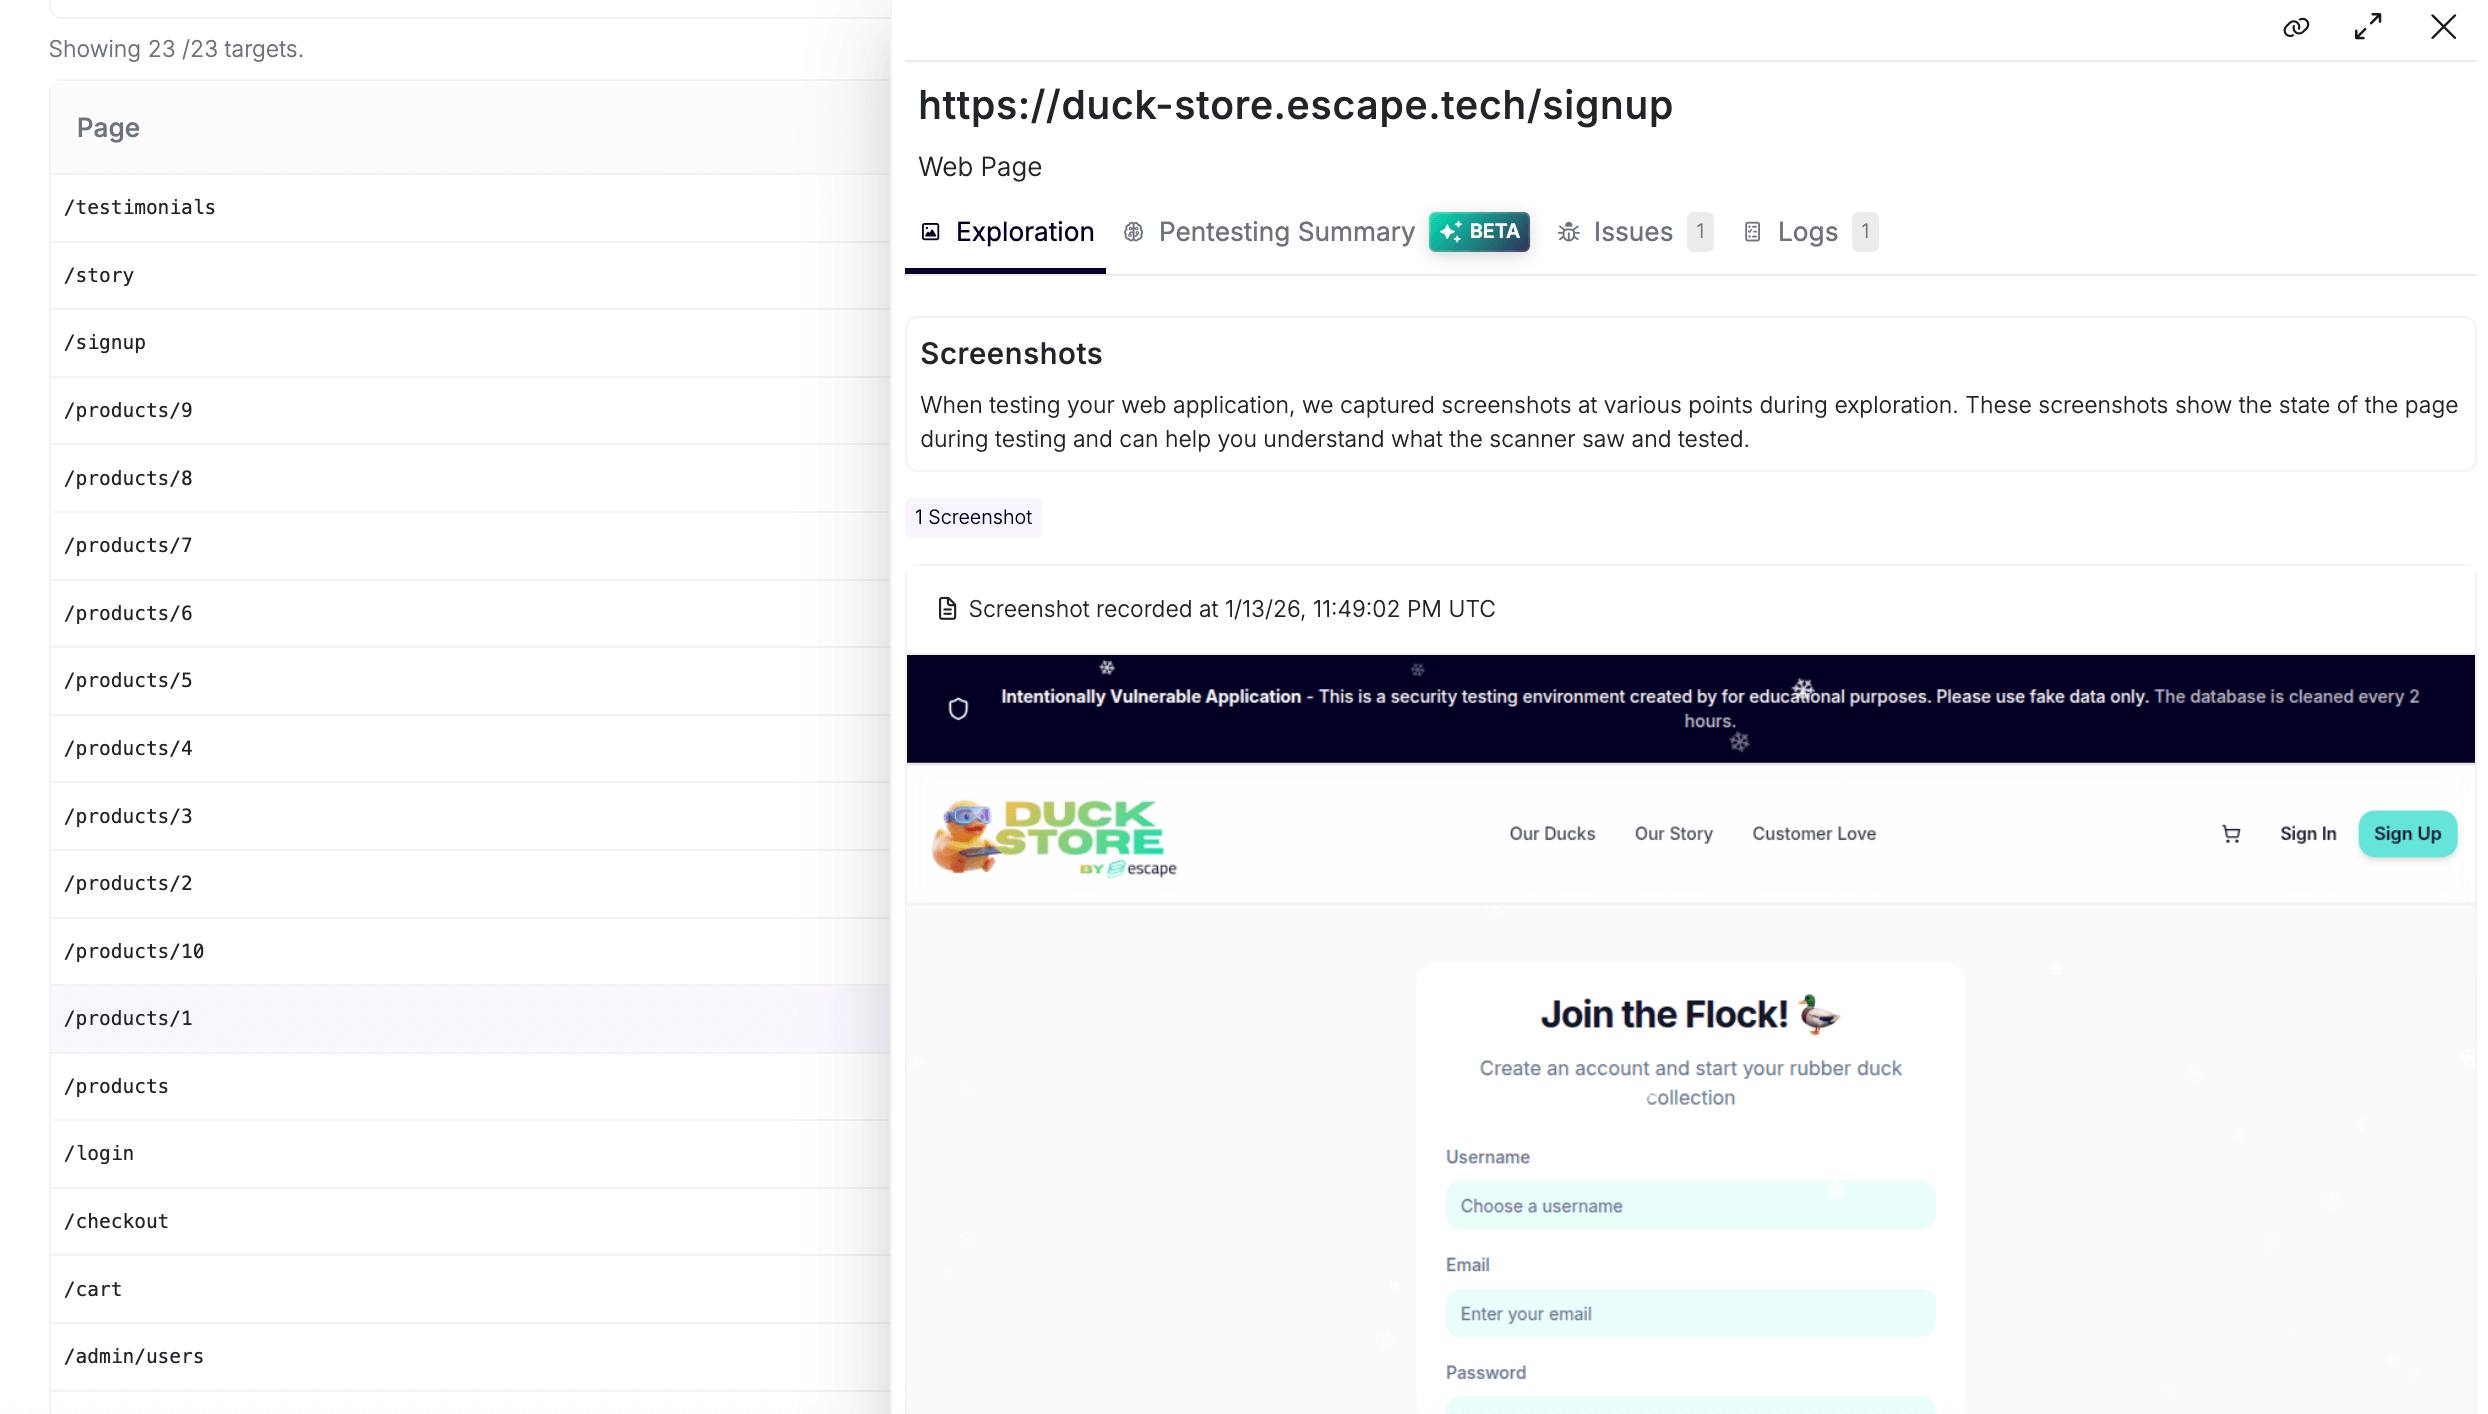
Web Application Coverage with Screenshots and Pentesting Summaries (Beta)
Escape now shows:
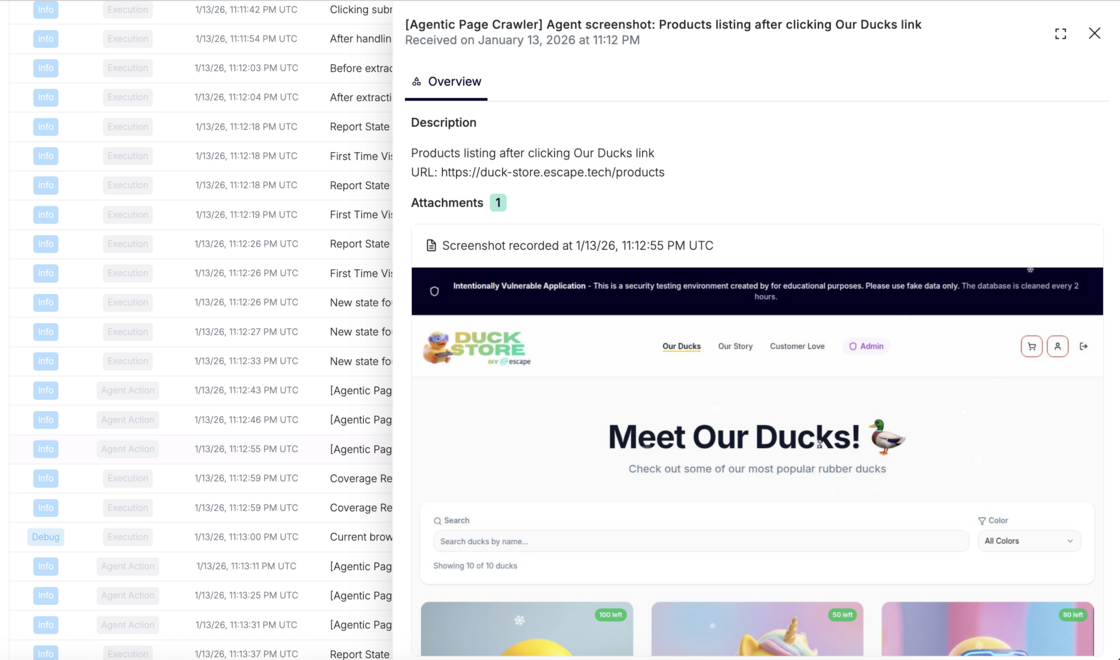
1. Coverage with Screenshots
Every unique application state reached during the crawl is:
- Captured as a screenshot

- Associated with a logical route
- Searchable and filterable by severity
2. Pentesting summary (Beta)
Beyond screenshot validation, Escape delivers AI-generated summaries that break down how vulnerabilities associated with a specific page were uncovered and precisely which attack attempts led to its discovery:
3. Associated Issues
In a dedicated tab, you can view all issues linked to this specific web page, giving you immediate visibility into what was found and where.
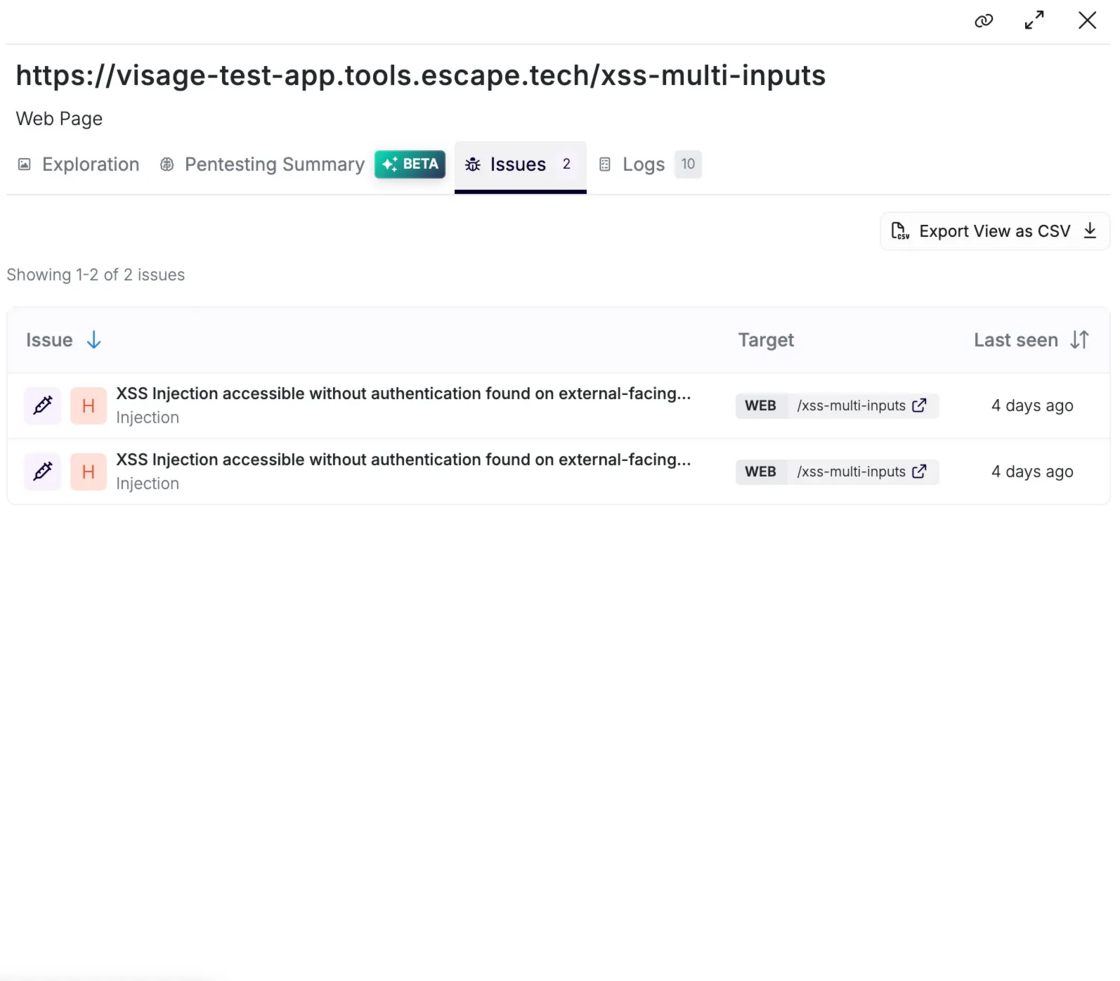
No more guessing whether a given page was touched during scanning.
💡
Behind the scenes: Escape’s RL-driven web crawler identifies similar page states and avoids redundant visits — now you can see exactly which unique states were tested and why.
Crawling View
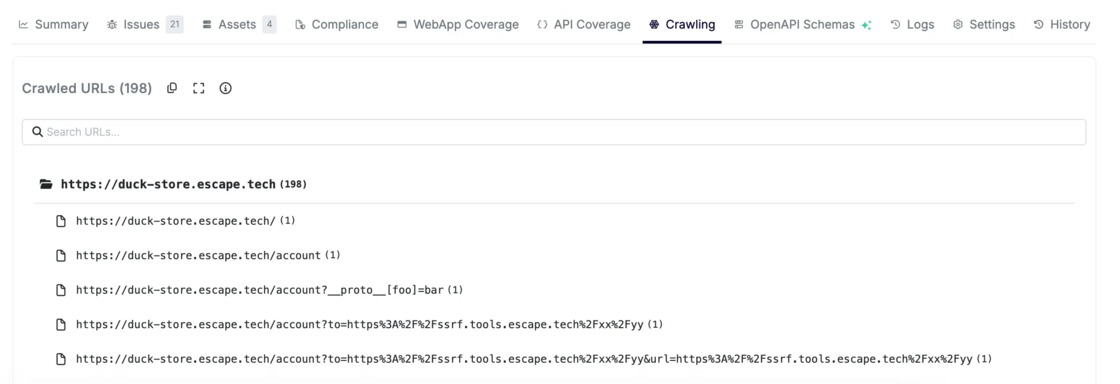
A structured list of all discovered pages organized by folder and hierarchy. This makes it easy to:
- Validate that important areas of the site were exercised
- Cross-reference against your sitemap
- Spot blind spots in discovery
API Coverage Within Web Testing
When web crawling triggers API calls (XHR/Fetch), those same coverage and attack path visualisation capabilities apply — giving you:
- Unified API visibility
- Integration into Attack Path Validation graphs
- Proven evidence of how frontend and backend interactions were exercised
This gives you end-to-end visibility, from UI action → API call → vulnerability.
With this release, Escape shifts dynamic testing from a black box to a glass box.
You don’t just see results of the scan, you see:
- How coverage was achieved
- Why authentication might have failed
- And where your real attack surface lies
Whether you’re validating that a critical part of a web app was tested, debugging a failed scan, preparing for an audit, or reviewing a production incident, Escape gives you the right evidence.
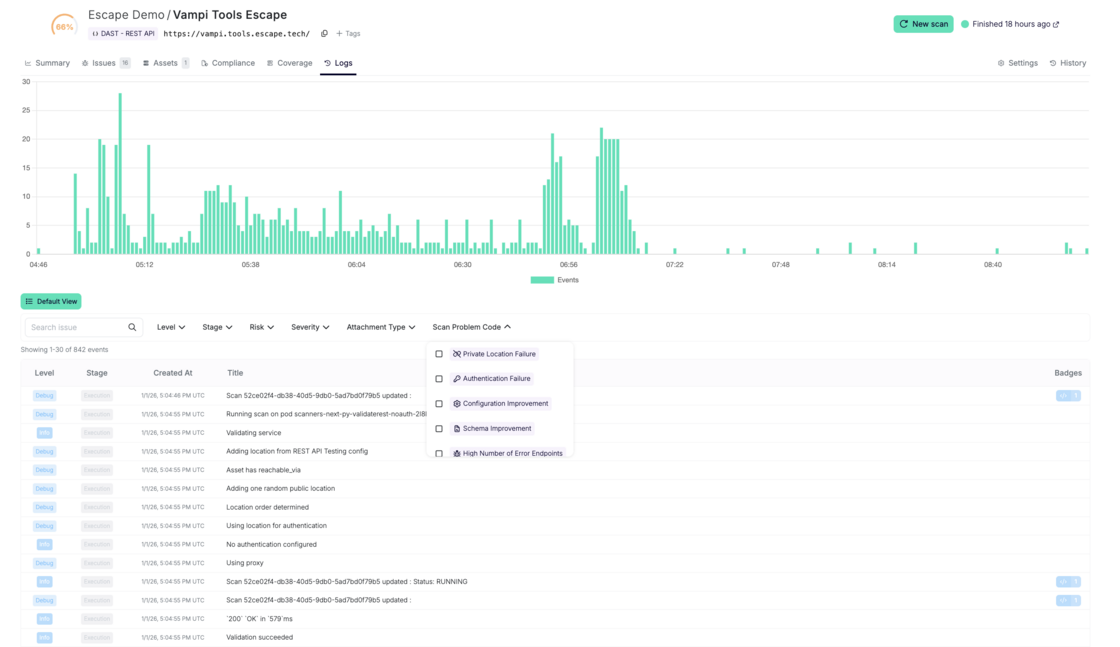
Improved Scan Logs Page: Stop Debugging Scans Blind and Improve Your Scan Performance
Escape’s improved Logs page gives you a complete, chronological view of everything that happens during a scan — and, crucially, why it happens.
By making every scanner decision, skip, and failure fully visible, Logs help you quickly diagnose issues, fine-tune configurations, and continuously improve scan coverage and reliability.
The result: less guesswork, faster debugging, and better scans over time.
What you’ll see in the Logs page
The Logs page shows every event associated with a scan, including:
- Configuration steps (schema download, auth detection, proxy usage)
- Execution steps (requests, responses, mutations)
- Issues found
- Agentic LLM reasoning and decisions (when enabled)
It helps to answer the following questions like
- "Why didn't the scanner find anything?" → It was blocked by your WAF, but you didn't know
- "Why is coverage so low?" → Authentication failed during the scan
You can search and filter logs by:
- Log level (debug, info, warning, error)
- Scan stage (configuration, execution, agent actions)
- Risk type (unauth access, sensitive data, external exposure…)
- Escape severity
- Scan problem codes (auth failure, WAF block, unreachable asset, timeout…)
to help you troubleshoot scan problems instantly:
- Filter by "Scan Problems" → see "Authentication Failure" logged at 8:04:26 AM → fix auth config → rescan
- Filter by "Blocked by WAF" → see exactly which requests triggered blocking → whitelist scanner IP
- Filter by "Rate Limit Exceeded" → adjust scan before next run
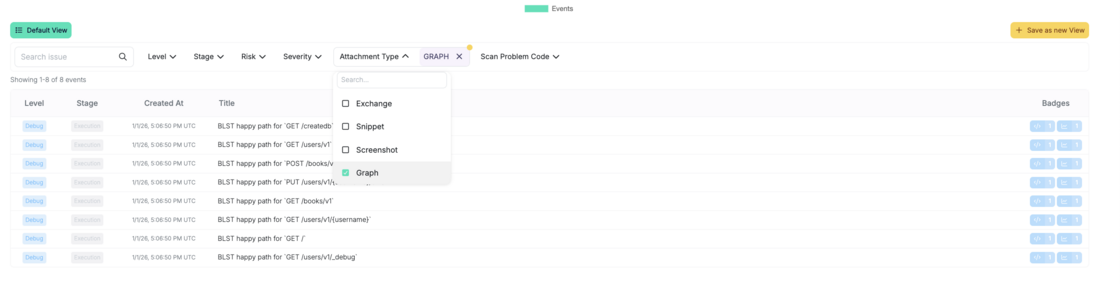
Each log entry is evidence-backed:
- Full request and response
- Attachments (exchange, snippet, attack validation path graph - to highlight when the execution path from the Escape business logic security testing engine was generated:
or screenshots captured via Agentic crawling:
- Clear explanation of why an issue was raised
You can even save filtered views to reuse during reviews or audits.
Feel free to explore!
Want to improve your current coverage? Check out our documentation.
💡 Want to get more out of Escape? Explore these guides to optimize your workflows, save time, and make your agentic pentesting or DAST tool even more efficient:
- How to Implement Multi-User Testing in DAST: Real-World Examples
- Reproduce complex exploits in Escape: Multi-Step Custom Rules Are Here
- Fixing Vulnerabilities Directly in your IDE with Escape MCP
- Apple's App Store Source Map Leak: A Preventable Vulnerability We Found in 70% of Organizations
*** This is a Security Bloggers Network syndicated blog from Escape - Application Security & Offensive Security Blog authored by Alexandra Charikova. Read the original post at: https://escape.tech/blog/how-to-visualize-coverage-and-validate-attack-paths/
如有侵权请联系:admin#unsafe.sh