2024-5-28 21:12:48 Author: hackernoon.com(查看原文) 阅读量:0 收藏
In many projects that boast integration with proprietary services, the question of collecting analytics on the availability of these services is very prevalent. This can be implemented in several ways, but the quickest method of all would be to use Firebase for its Performance Monitoring. This method is by far the most accessible out of the bunch. Once (or if) you decide to integrate this module into your project, you can automatically track requests and also have the option to add custom events to track the time spent on them. So, if the main goal of your project is to monitor latency from different regions, you can ditch this article and go straight to Firebase.
If, however, you need to gather additional information, such as tracking client-side parser failures or monitoring server responses, I’ll discuss a more suitable method.
InfluxDB
InfluxDB is a database that collects time-series data events. With this, you have two options: Cloud and open-source solutions. Since in our case we need to isolate from our servers, we can use the cloud option. The free quota will allow you to keep data for a month and view it online, as well as build graphs, analyze data, and send it to more permanent storage if you need to do so.
Setting up
The registering process is easy, all you need to do is go to

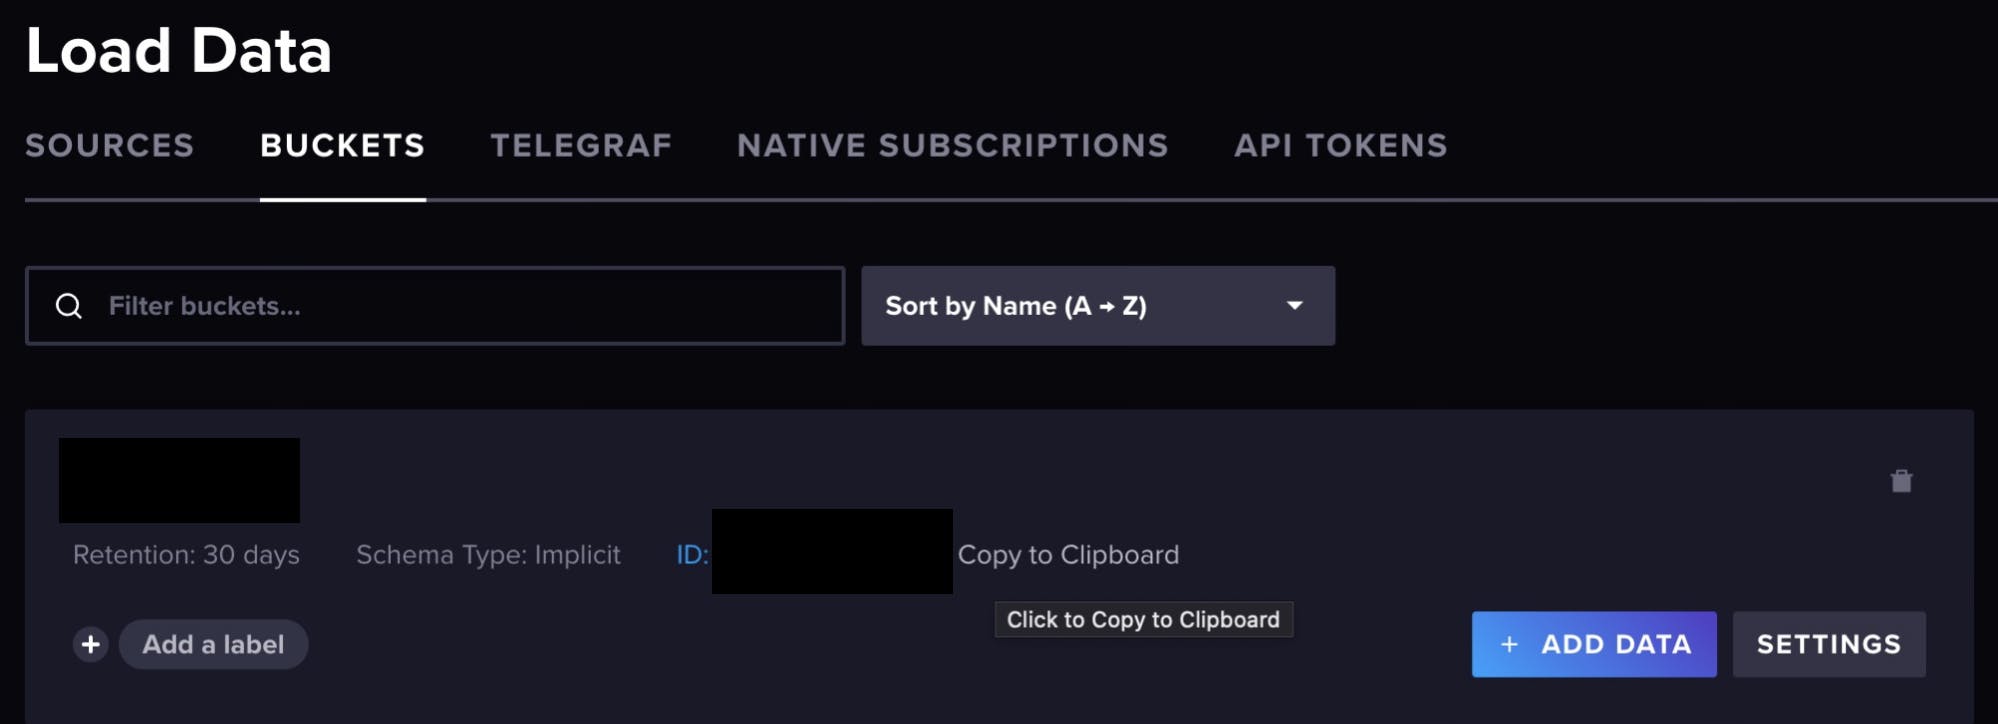
Now you can save the generated token and bucket ID, and proceed to the project. The bucket ID can be viewed here:

Database contents
To implement the integration on iOS I will be using a simple session as an example. At this stage, it is important to consider what data we are about to send, what data will be tags, and what will be values. Since in InfluxDB you can only build queries based on a single value, I would suggest including the following values: the time spent on the request or the reason why the request failed.
The structure for sending a request to the database looks like this:
measurementName,tagKey=tagValue fieldKey="fieldValue" 1465839830100400200
--------------- --------------- --------------------- -------------------
     |               |                  |                    |
Measurement       Tag set           Field set            Timestamp
First, we’ve got the Measurement, which will be the name of the so-called "table," followed by tags, values, and a timestamp, also separated by commas. All of the parts except tags are mandatory. Here I suggest using the following values as tags: module name; request origin; host; path; user location (if available), etc.
There are several types of field values:
- Float: numbers in float format - IEEE-754
- Integer: integer value, I recommend you add i at the end, but not mandatory (e.g., 12485903i)
- UInteger: unsigned integer value, written with a u at the end, similar to regular integers
- String: string limited to 64KB in size, should be enclosed in quotes
- Boolean: standard boolean, possible values are
t/f,T/F,true/false,True/False,TRUE/FALSE
Here's an example of how you can structure your request for sending data to InfluxDB:
private extension Dictionary where Key == String {
    func toInfluxLine(wrapString: Bool = true) -> String? {
        var fields: [String] = []
        for (key, value) in self {
            let converted: String
            switch value {
            case let float as Float: converted = "\(float)"
            case let double as Double: converted = "\(double)"
            case let integer as Int: converted = "\(integer)i"
            case let uInteger as UInt: converted = "\(uInteger)u"
            case let string as String: converted = wrapString ? "\"\(string)\"" : string
            case let bool as Bool: converted = bool ? "true" : "false"
            default: continue
            }
            fields.append("\(key)=\(converted)")
        }
        guard !fields.isEmpty else { return nil }
        return fields.joined(separator: ",")
    }
}
Database collection
Once you have determined the contents of your requests, you can now draft an example of what data collection will look like:
final class NetworkManager: NSObject, URLSessionDataDelegate {
    let session = URLSession(configuration: .default)

    func makeRequest() async throws {
        let url = URL(string: "https://www.google.com/")!
        let _ = try await URLSession.shared.data(from: url, delegate: self)
    }

    func trace(url: URL?, duration: TimeInterval) {
        guard let url = url else { return }
        print("Host:", url.host ?? "-", "Path:", url.relativePath, "Duration:", duration)
    }

    // MARK: - URLSessionDataDelegate

    func urlSession(_ session: URLSession, task: URLSessionTask, didFinishCollecting metrics: URLSessionTaskMetrics) {
        trace(url: task.currentRequest?.url, duration: metrics.taskInterval.duration)
    }
}
A test request can look like this:
let manager = NetworkManager()
do {
    try await manager.makeRequest()
} catch {
    print("Error:", error.localizedDescription)
}
Here you can see that for each request we attach a delegate to collect data about the task execution process. In other frameworks, this will, of course, look different. For example, in Alamofire, you can get request metrics from the final closure, but, unfortunately, given the space I have within this article, it can be difficult to cover all the options within this post.
Sending data
So, now we have all the data we want to send off – it is time to start the actual sending process. For that, we’ll need the cloud address you chose for storage, the token you received earlier, and the bucket ID. You can send the data in two ways: as plain text or as a gzip. Here, I will show how to send it as plain text; compressing it later if there is a lot of data won’t be difficult. Let's write a separate class that will handle the sending.
final class InfluxDbService {
    let host: String
    let bucketId: String
    let session: URLSession

    init(host: String, bucketId: String, token: String) {
        self.host = host
        self.bucketId = bucketId

        let configuration = URLSessionConfiguration.default
        configuration.httpAdditionalHeaders = [
            "Content-Type": "text/plain; charset=utf-8",
            "Accept": "application/json",
            "Authorization": "Token \(token)"
        ]
        session = URLSession(configuration: configuration)
    }

    public func addMetrics(url: URL, duration: TimeInterval) {
        let measurement = "APIHealth"
        var tags: [String: Any] = [:]
        tags["host"] = url.host
        tags["path"] = url.relativePath
        var fields: [String: Any] = [:]
        fields["duration"] = duration

        guard !fields.isEmpty else { return }

        var message = measurement
        if let line = tags.toInfluxLine(wrapString: false) { message += "," + line }
        if let line = fields.toInfluxLine() { message += " " + line }
        let timestamp = Int(1000 * Date().timeIntervalSince1970)
        message += " \(timestamp)"

        let url = URL(string: "\(host)/api/v1/write?bucket=\(bucketId)&precision=ms")!
        var request = URLRequest(url: url)
        request.httpMethod = "POST"
        request.httpBody = message.data(using: .utf8)
        session.dataTask(with: request).resume()
    }
}
Here you can see the sending of our formatted string to the address(host)/api/v1/write?bucket=(bucketId)&precision=ms, where:
- host is the cloud address;
- bucketId is the bucket identifier;
- precision is the time precision we sent.
At this stage, it wouldn’t be very practical to send metrics every time a request is made; gathering them together and sending them at regular intervals, such as every five seconds, would be much more efficient. Therefore, I’d suggest expanding the class functionality and adding a Timer that will work in debounce mode, i.e., it will reset every time until the timeout occurs.
To achieve this you can change the request-sending moment to add a message to an array that will trigger the creation of a timer:
var metrics: [String] = [] { didSet { debounceTimer() } }
var timer: Timer?

func addMetrics(url: URL, duration: TimeInterval) {
    ...
    metrics.append(message)
}
Here the interval is set to 5 seconds, which will trigger the send-off of metrics:
private func debounceTimer() {
    DispatchQueue.main.async { [metrics, weak self] in
        self?.timer?.invalidate()
        guard !metrics.isEmpty else { return }
        self?.timer = Timer.scheduledTimer(withTimeInterval: 5.0, repeats: false) { _ in self?.submitMetrics() }
    }
}
Now you can collect the metrics into a single message and send them off again:
private func submitMetrics() {
    guard !metrics.isEmpty else { return }
    let message = metrics.joined(separator: "\n")
    metrics = []

    let url = URL(string: "\(host)/api/v1/write?bucket=\(bucketId)&precision=ms")!
    var request = URLRequest(url: url)
    request.httpMethod = "POST"
    request.httpBody = message.data(using: .utf8)
    session.dataTask(with: request).resume()
}
And don't forget about the app termination moment.
You can add a subscription to this event in the initialization of our service:
NotificationCenter.default.addObserver(
    forName: UIScene.willDeactivateNotification,
    object: nil,
    queue: nil) { [weak self] _ in self?.submitMetrics() }
The entire class code will look something like this:
final class InfluxDbService2 {
    let host: String
    let bucketId: String
    let session: URLSession
    var metrics: [String] = [] { didSet { debounceTimer() } }
    var timer: Timer?

    init(host: String, bucketId: String, token: String) {
        self.host = host
        self.bucketId = bucketId

        let configuration = URLSessionConfiguration.default
        configuration.httpAdditionalHeaders = [
            "Content-Type": "text/plain; charset=utf-8",
            "Accept": "application/json",
            "Authorization": "Token \(token)"
        ]
        session = URLSession(configuration: configuration)

        NotificationCenter.default.addObserver(
            forName: UIScene.willDeactivateNotification,
            object: nil,
            queue: nil) { [weak self] _ in self?.submitMetrics() }
    }

    func addMetrics(url: URL, duration: TimeInterval) {
        let measurement = "APIHealth"
        var tags: [String: Any] = [:]
        tags["host"] = url.host
        tags["path"] = url.relativePath
        var fields: [String: Any] = [:]
        fields["duration"] = duration

        guard !fields.isEmpty else { return }

        var message = measurement
        if let line = tags.toInfluxLine(wrapString: false) { message += "," + line }
        if let line = fields.toInfluxLine() { message += " " + line }
        let timestamp = Int(1000 * Date().timeIntervalSince1970)
        message += " \(timestamp)"

        metrics.append(message)
    }

    private func debounceTimer() {
        DispatchQueue.main.async { [metrics, weak self] in
            self?.timer?.invalidate()
            guard !metrics.isEmpty else { return }
            self?.timer = Timer.scheduledTimer(withTimeInterval: 5.0, repeats: false) { _ in self?.submitMetrics() }
        }
    }

    private func submitMetrics() {
        guard !metrics.isEmpty else { return }
        let message = metrics.joined(separator: "\n")
        metrics = []

        let url = URL(string: "\(host)/api/v1/write?bucket=\(bucketId)&precision=ms")!
        var request = URLRequest(url: url)
        request.httpMethod = "POST"
        request.httpBody = message.data(using: .utf8)
        session.dataTask(with: request).resume()
    }
}
Analytics
Now that you have data collection and sending in place, you can start creating dashboards and graphs, so, let's return to the InfluxDB panel and try to create a dashboard.
This stage gives us limitless possibilities, one of them is the ability to create a graph by hosts.
To do this we will need to make a query like this:
from(bucket: "BucketName")
  |> range(start: v.timeRangeStart, stop: v.timeRangeStop)
  |> filter(fn: (r) => r["_measurement"] == "APIHealth" and r["_field"] == "duration")
  |> group(columns: ["host"])
  |> aggregateWindow(every: v.windowPeriod, fn: mean, createEmpty: false)
  |> yield(name: "mean")
Don’t be afraid to experiment with different display options to find what best suits your specific needs.
To conclude
As we can see from researching various options for analytics, it is easy to conclude that influx is the best fit here, since with it you can identify bottlenecks in the API's operation and solve issues with client-side implementation. If you want (or need to) in the future, you can create a system for alerting you about issues with access from specific countries or determine which parts of the API can be pre-cached to speed up client access to data.
如有侵权请联系:admin#unsafe.sh