2024-5-15 23:33:41 Author: hackernoon.com(查看原文) 阅读量:0 收藏
Authors:
(1) Eilidh Jack, School of Mathematics and Statistics, University of Glasgow, Glasgow, G12 8QQ ([email protected]);
(2) Craig Alexander, School of Mathematics and Statistics, University of Glasgow, Glasgow, G12 8QQ ([email protected]);
(3) Elinor Jones, Department of Statistical Science, University College London, London, WC1E 7HB ([email protected]).
Table of Links
- Abstract and Introduction
- Course information
- Motivation and intervention
- Findings
- Discussion
- Conclusion and References
4 Findings
Below we will present findings which relate to the questions of interest listed in Section 3.
4.1 Comparison within year (same students, different courses)
We consider engagement levels for the same group of students across two semesters: in semester 1 Level Up! was not used, but in semester 2 it was fully implemented. Figure 1 (b) shows the cumulative mean percentage of students engaging in the pre-lecture quizzes each week across a 9 week period in semester 2 of 2022-23. Of the 100 students who provided consent in semester 1 of 2022-23, 83 continued to study statistics in semester 2. Therefore, the data displayed in this figure relate to a subset of the same students in Figure 1 (a) that provided consent to take part in this study across an entire academic year. It is immediately clear that overall the levels of engagement in semester 2 of 2022-23 (after Level Up! was implemented) are higher when comparing to semester 1 (before Level Up! was implemented) as shown in Figure 1 (a). Similar to Figure 1 (a), a drop-off in completion of pre-lecture quizzes for each week is still observed, however the baseline level of engagement for each week remains substantially higher, with the lowest mean engagement for a collection of weekly pre-lecture quizzes in the week the material is covered in-class being 25% in Week 9. This is around the same level as for Week 1 in Figure 1 (a), which showed the highest levels of engagement across the semester. This suggests that Level Up! has had a positive impact on engagement in pre-lecture quizzes across this student cohort. Another key feature of this figure is the clear drop-off in engagement after Week 1, which can be seen by the red line (associated with Week 1 materials) sitting considerably higher and separate to the lines representing the other weeks. This indicates that the effect of Level Up! on engagement drops more substantially from week 1 to week 2 compared to any other pairs of weeks and could be attributed to the initial excitement of the gamification and competition wearing off after week 1. Despite this, it can still be concluded that over the course of the semester the levels of engagement in the pre-lecture quizzes were higher than for semester 1. The average percentage of students engaging in the pre-lecture quizzes during the corresponding teaching week is also shown in Table 1. These figures correspond to the first point in each weekly line in Figures 1 (a) and 1 (b).
In order to confirm the increase in engagement that can be seen in semester 2 (Figure 1 (b)) compared to semester 1 (Figure 1 (a)), a 95% confidence interval was computed which compares the difference in average proportion of pre-lecture quizzes completed in the week the material is covered in class for semester 1 and 2 for each student who participated in the study. The 95% confidence interval for the mean difference in engagement between semester 1 and semester 2 is (−0.29 − 0.15) suggesting that the implementation of Level Up! significantly improved the proportion of pre-lecture quizzes completed by the students.
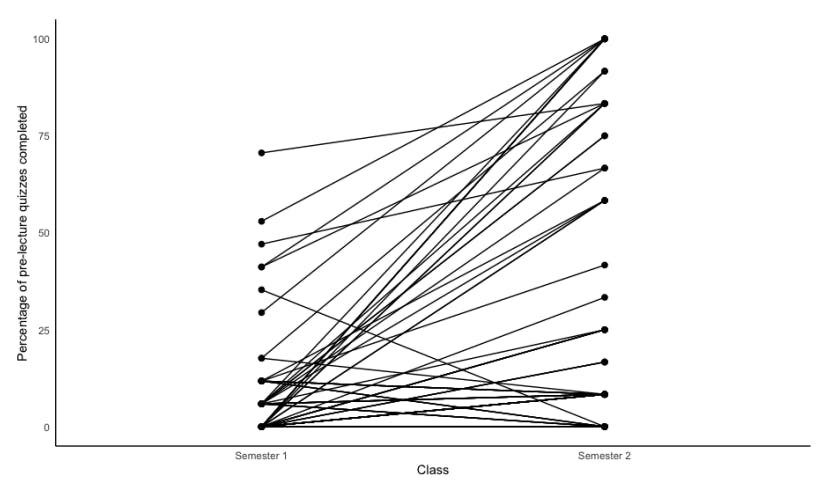
We were also interested in whether all students were more engaged (in general) in semester 2, or if the gamification aspect was drawing out students who were not engaged in semester 1 who then go on to become very engaged in semester 2. Figure 3 shows the average engagement levels of the 83 students who were enrolled in both courses in 2022-23 across both semesters, with each pair of points and connecting line representing one student. This figure shows some interesting features. Firstly, as we would expect, the engagement levels tend to increase for most students across both semesters, however there are some instances where engagement levels decrease. For students who had comparatively high levels of engagement in semester 1, we tend to see a reasonable increase in semester 2 indicating

that students who were already more engaged than their peers are likely to engage further after the implementation of Level Up!. We also see a number of very sharp increases from semester 1 to semester 2 for students who were not very engaged (or not engaged at all) in semester 1, who then show some of the highest engagement levels in semester 2. For these students it seems that the gamification element drastically improved their motivation and engagement levels and is evidence that including a gamification element to a course may encourage engagement from students who would otherwise not engage.
Despite these positive results, there may be other factors which could affect the engagement levels across these semesters. Engagement levels may be impacted by the materials which are covered in each course, as these will will differ from one semester to the next, and to compound matters, the teaching team differed between semesters. However, in general, course evaluations show that students are very positive about the teaching across both semesters and rate the teaching team very highly in both courses.
It is not possible to investigate the effect of Level Up! on end-of-semester exam performance within the 2022-23 cohort since each course covers different material. However, we can assess meaningful engagement with the formative reading quizzes by monitoring grades for these quizzes. The average percentage grade for formative reading quizzes in semester 1 of 2022-23 was 68% compared to 69% for semester 2 of 2022-23. These percentages only include students who completed the quizzes and so we would not necessarily expect to see an increase in percentage grade after the implementation of Level Up! but it is reassuring to see that the average percentage grade is similar to the previous semester indicating that, in general, students are engaging with these quizzes in a meaningful way rather than just completing them to gain points and ‘game’ the leaderboard.
4.2 Comparison between years (different students, same course)
The second question of requires us to compare engagement levels for different groups of students for the same course (i.e. same semester) across two academic years. In 2022-23, Level Up! was not implemented and in 2023-24 it was. There were some small changes made to the course materials between these years, however the course aims, intended learning outcomes and structure remained the same. Figure 1 (c) shows the cumulative mean percentage of students engaging in the pre-lecture quizzes each week across a 11 weeks in semester 1 of the 2023-24 academic year. The data displayed in this figure relate to different students than in Figure 1 (a) but for the same course. When comparing to Figure 1 (a) it is again very clear to see that overall engagement levels in the pre-lecture materials were substantially higher after Level Up! was implemented.
In week 1, around 82% of students had completed the pre-lecture quizzes, compared to only around 27% for the same material in 2022-23. Although we still see a drop-off in engagement through the semester, the engagement levels in each week always remain substantially higher than observed the previous year. We also see a larger drop in engagement between weeks 3 and 4, although interestingly this comes later when compared to semester 2 of 2022-23 (Figure 1 (b)) where a large drop-off occurred after week 1. Overall, engagement levels are higher for semester 1 of 2023-24 compared to semester 2 of 2022-23, even though both courses implemented Level Up!. This may be explained by the observation that students are generally more engaged at the beginning of an academic year, particularly for a Level 1 course where most students are studying at University for the first time. The average percentage of students engaging in the pre-lecture quizzes during the corresponding teaching week is also shown in Table 1. These figures correspond to the first point in each weekly line in Figures 1 (a) and 1 (c).
In order to confirm the increase in engagement that can be seen in semester 1 of 2023-24 (Figure 1 (c)) compared to semester 1 of 2022-23 (Figure 1 (a)), a 95% confidence interval was computed which compares the average proportion of pre-lecture quizzes completed by each student in the week the material is covered in class for each year. The 95% confidence interval for the mean difference in engagement between 2022-23 and 2023-24 is (−0.53 − 0.37) suggesting that the implementation of Level Up! significantly improved the proportion of pre-lecture quizzes completed by the students.
It was also of interest to compare achievement in this course across both cohorts to understand if the increased engagement led to better understanding of the material amongst the students. At course level, we believe the increased engagement has contributed to an increase in performance with 82% of students receiving a grade of A, B or C in the semester 1 course of 2023-24 compared to 60% in 2022-23. We can also assess meaningful engagement with the formative reading quizzes by monitoring grades for these quizzes. The average percentage grade in formative reading quizzes semester 1 of 2023-24 was 64% compared to 68% for semester 1 of 2022-23. Again, these percentages only include students who completed the quizzes and so we would not necessarily expect to see an increase in percentage grade after the implementation of Level Up! but it is reassuring to see that the average percentage grade is similar to the previous year indicating that, in general, students are engaging with these quizzes in a meaningful way rather than just completing them to gain points.
As in Section 4.1, it should be noted that there may be other factors which could affect the engagement levels and performance across these cohorts. Clearly the set of students in each cohort was different and so some of the changes we identified could be attributed to a cohort effect. There was also a change in the teaching team, with a change in one (of two) course lecturers. However, in general, course evaluations from each year show that students were very positive about the teaching team across both years. The changes identified in performance will also be impacted by a different exam paper, however the material covered and difficulty level of the paper was kept as consistent as possible between the two years.
如有侵权请联系:admin#unsafe.sh