In today’s fast-paced landscape of container orchestration, Kubernetes is a powerful tool for man 2024-2-16 03:34:22 Author: securityboulevard.com(查看原文) 阅读量:14 收藏
In today’s fast-paced landscape of container orchestration, Kubernetes is a powerful tool for managing and scaling applications. However, ensuring the security and compliance of these environments cannot be overlooked. One crucial aspect of building a successful application includes handling Kubernetes audit logs. These logs provide vital insights into the activities within your cluster, enabling you to track changes, troubleshoot issues, and maintain regulatory compliance.
In this blog, I’ll break down the basics of what you need to know and provide insight into how to enable audit logging in Kubernetes to monitor the logs in a security information and event management system.
Getting Started with Kubernetes Audit Logs
Before diving in deep, here is some background information on what Kubernetes is and why cybersecurity professionals need to monitor Kubernetes Audit Logs.
Kubernetes is an open-source platform for managing containerized workloads. Applications can be encapsulated as a lightweight container image and deployed on any machine capable of running container images.
Users expect applications to be up and running all the time. Kubernetes is a production-ready orchestration platform that helps you deploy containerized applications for computing resources needed. Developers can use Kubernetes to deploy the applications, version upgrades, automated rollbacks, and auto-scaling of the applications without any downtime.
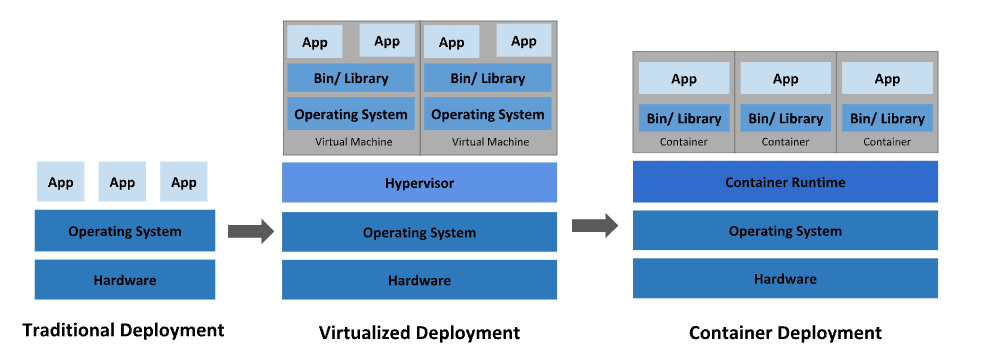
Containers are kind of like virtual machines (VMs) or pods that form the fundamental building blocks of an application in Kubernetes. They are isolated from other containers and the host machine, which is where they get their name. You can completely isolate a guest operating system running on a VM. Containers run on top of a host operating system such as Linux or Windows. Containers are sandboxed processes on a machine that are isolated from all other processes running on that host machine.
Kubernetes containers are portable and lightweight images with all dependencies and configurations running on an isolated environment removing the operating system (OS) layer. A single OS kernel can run multiple containers. Containers do not require boot time like a VM does. Containers are flexible, efficient, distributed, and consistent. Each one has its own memory, CPU share, process space, and more.
Dockers are the most widely used containerized platform and are easy to start. Docker enables the developer to easily pack, ship, and run the applications virtually anywhere.
The Importance of Kubernetes Audit Logs
Kubernetes audit logs help maintain security, compliance, and operational integrity within a Kubernetes cluster. They provide a detailed record of all actions and events, offering insight into who accessed the system, what actions were performed, and when they occurred.
While Kubernetes monitoring tools focus on performance and resource management, audit logs primarily serve security, compliance, and operational integrity objectives. By leveraging a Kubernetes audit log, administrators can detect and investigate security breaches, troubleshoot issues, track configuration changes, and ensure adherence to regulatory requirements — ultimately enhancing the overall reliability and trustworthiness of the Kubernetes environment.
Security and Compliance Considerations
The Kubernetes ecosystem is a dynamic one. Containerized applications are constantly being deployed, scaled, and updated. Kubernetes audit logs play a pivotal role in meeting various security and compliance requirements such as:
- Health Insurance Portability and Accountability Act (HIPAA)
- Payment Card Industry Data Security Standard (PCI DSS)
- General Data Protection Regulation (GDPR)
- National Institute of Standards and Technology (NIST) Cybersecurity Framework
How Kubernetes Audit Logs Help You Meet These Standards
Here are examples of how they contribute to meeting compliance standards.
- Visibility and Accountability: Kubernetes audit logs provide visibility into system activities, enabling organizations to track user actions, resource accesses, and configuration changes. This transparency fosters accountability and ensures adherence to security policies and regulatory requirements.
- Forensic Analysis and Incident Response: In the event of a security breach or compliance violation, Kubernetes audit logs serve as a vital source of information for forensic analysis and incident response. By tracing back the sequence of events recorded in the logs, security teams can identify the root cause of incidents, assess the extent of damage, and take appropriate remedial actions.
- Continuous Monitoring and Alerting: Automated monitoring of Kubernetes audit logs allows you to detect suspicious activities and anomalies in real time. By configuring alerts based on predefined security policies and thresholds, deviations from normal behavior can be promptly identified, investigated, and mitigated. This serves to greatly reduce the risk of security breaches and compliance failures.
- Evidence for Audits and Compliance Reporting: During audits and compliance assessments, Kubernetes audit logs serve as concrete evidence of security controls implementation and adherence to regulatory requirements. Presenting comprehensive and well-maintained audit trails demonstrate your commitment to maintaining a secure and compliant Kubernetes environment.
Understanding Kubernetes Audit Logs
Kubernetes audit logs capture a comprehensive record of all activities and events occurring within the cluster, including user actions, API requests, and configuration changes. These logs are invaluable for security, compliance, and troubleshooting purposes, enabling administrators to track changes, detect unauthorized access or actions, investigate incidents, and maintain regulatory compliance.
The Different Types of Events Captures in Kubernetes Audit Logs
Kubernetes audit logs offer administrators valuable insights into the activities occurring within their clusters, facilitating security monitoring, compliance enforcement, troubleshooting, and incident response efforts.
Various types of events are captured to provide a comprehensive record of activities within the cluster. Some common types of events include:
- Resource Access: These events track actions related to accessing Kubernetes resources such as pods, services, configmaps, secrets, and persistent volumes. Examples include requests to create, read, update, or delete these resources.
- Authentication and Authorization: Events related to user authentication and authorization are logged, including successful and failed login attempts, token authentication, role-based access control (RBAC) decisions, and authorization failures.
- API Server Requests: Kubernetes API server requests are documented, including API calls to list resources, watch for changes, create or update objects, and perform operations like scaling deployments or updating configurations.
- Policy Enforcement: Events related to the enforcement of network policies, pod security policies, and other Kubernetes security policies are captured. This includes actions taken by admission controllers to validate and enforce policies.
- Cluster-Level Operations: Events involving cluster-wide operations such as node management, pod scheduling, namespace creation, role binding updates, and cluster role assignments are recorded to provide visibility into administrative activities.
- Audit Configuration Changes: Changes to the audit logging configuration itself, such as modifications to audit policy rules, log storage settings, or audit sink configurations, are also tracked to clarify changes to the auditing setup.
Kubernetes Architecture
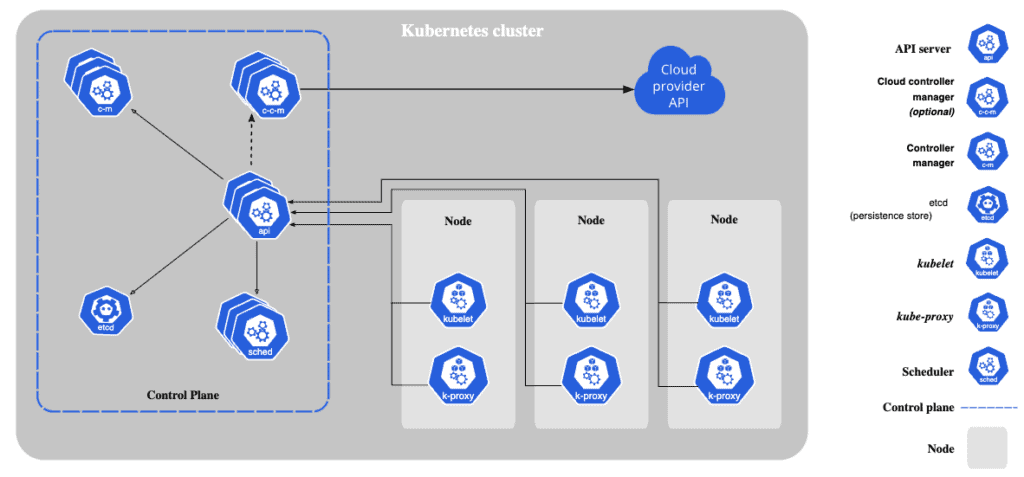
Kubernetes cluster consists of a single node or multiple nodes. In Kubernetes, if you need to run a single container, the container will be created inside a pod. A pod can have a single container or multiple containers.
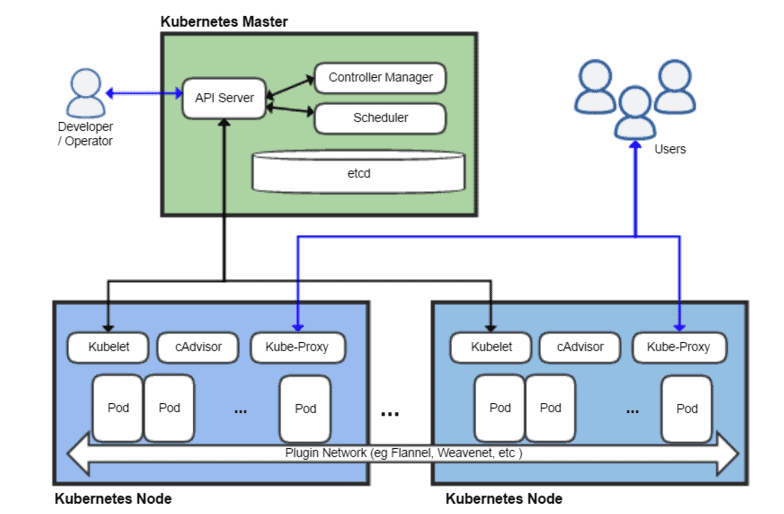
Kubernetes Cluster Auditing
Control plane manages the worker nodes, and the worker nodes host the pods. The API server is a component of the Kubernetes control plane that exposes the Kubernetes API. The core component of the control plane is the kube-apiserver. The kube-apiserver is a rest based front end service for all the external users, nodes, and services to interact with each other. Every command executed in the Kubernetes environment will be processed by the kube-apiserver. The Kubernetes API server is responsible for authentication and authorization.
Kubernetes API Audit Logs
Kubernetes API records all the API requests made to kube-apiserver by the users and the Kubernetes internal services as well. The audit log provides a lot of information such as source IP address, time of the request, user info, and request and response information. Audit logs trace abnormalities in the cluster environment such as failed login attempts or any malicious activity.
How to Ingest and Monitor Kubernetes Audit Logs with LogRhythm
In a Kubernetes setup, it’s vital to track and understand events generated by users and applications using the Kubernetes API. To enhance cybersecurity, LogRhythm Axon is a cloud-native SIEM that helps security teams effectively monitor and detect potential attacks within the Kubernetes environment. Let’s break down how you can enable audit logging in Kubernetes and forward the logs to the SIEM solution.
Kubernetes Audit Policy
Audit logs are not enabled by default. An audit policy should be defined on what events are to be captured.
Create a directory /etc/kubernetes/audit and create a file named audit.yaml
apiVersion: audit.k8s.io/v1
kind: Policy
rules:

- level: None
  verbs: ["get", "watch", "list"]

- level: None
  resources:
  - group: "" # core
resources: ["events"]

- level: None
  users:
  - "system:kube-scheduler"
  - "system:kube-proxy"
  - "system:apiserver"
  - "system:kube-controller-manager"
  - "system:serviceaccount:gatekeeper-system:gatekeeper-admin"

- level: None
  userGroups: ["system:nodes"]

- level: RequestResponse
Add the following entries in the manifests file to the path where the audit logs should be written and the location of the audit policy.
Edit the /etc/kubernetes/manifests/kube-apiserver.yaml
- --audit-policy-file=/etc/kubernetes/audit/policy.yaml
- --audit-log-path=/var/log/kubernetes/audit/audit.log
volumeMounts:
  - mountPath: /etc/kubernetes/audit-policy.yaml
name: audit
readOnly: true
  - mountPath: /var/log/kubernetes/audit/
name: audit-log
readOnly: false
Finally, configure the host path.
volumes:
- name: audit
  hostPath:
path: /etc/kubernetes/audit-policy.yaml
type: File

- name: audit-log
  hostPath:
path: /var/log/kubernetes/audit/
type: DirectoryOrCreate
The Different Stages of an Audit Policy
Stage #1 RequestReceived
This stage captures events as soon as the Kubernetes audit handler receives the request. It marks the initiation of the audit logging process and includes details about the incoming request, such as the client IP address, HTTP method, requested resource, user identity, and any associated metadata. Events at this stage are valuable for tracking the initiation of actions within the Kubernetes cluster and provide insight into who is making requests and what resources are being accessed.
Stage #2 ResponseStarted
Events in this stage occur once the response headers are sent back to the client, but before the response body is transmitted. These events capture information related to the server’s initial response to the client request, including HTTP status codes, response headers, and metadata. Monitoring this stage allows administrators to track the beginning of server responses and assess the initial outcome of client requests.
Stage #3 ResponseComplete
This stage represents events that occur after the response body has been fully transmitted to the client. It marks the completion of the server’s handling of the client request and includes any final details or metadata related to the response. Events in this stage provide a comprehensive view of the entire request-response lifecycle, allowing administrators to analyze the full scope of interactions between clients and the Kubernetes API server.
Stage #4 Panic
These are events generated when a panic occurs within the Kubernetes audit logging system. A panic typically indicates a severe error or unexpected condition that causes the application to terminate abruptly. While panics are rare in a well-maintained system, capturing events at this stage can be crucial for diagnosing and troubleshooting critical failures within the audit logging infrastructure. These events may include stack traces, error messages, and other diagnostic information to aid in identifying the root cause of the panic and restoring system functionality.
In this example, I bootstrapped my Kubernetes cluster using kubeadm, and below are the master node and the two worker nodes in my setup.
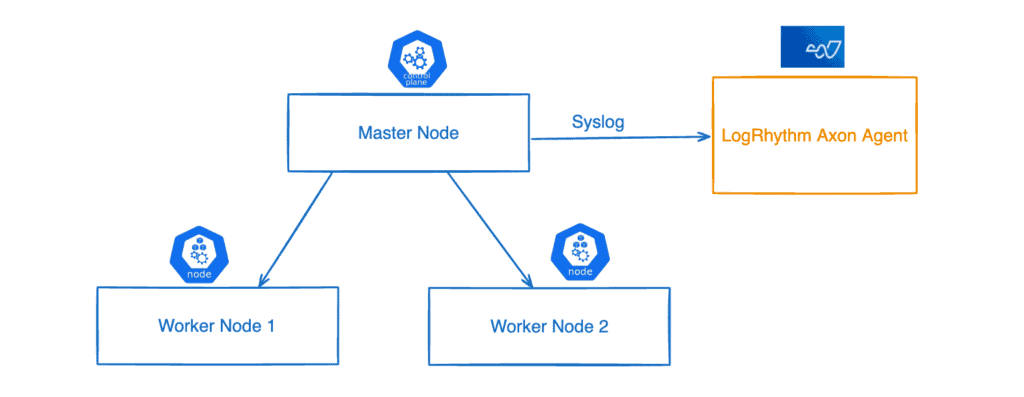

How do you ship the logs from Kubeadm deployed Cluster to LogRhythm Axon? The below syslog config will ship the Kubernetes audit logs to the LogRhythm Axon agent over Transmission Control Protocol (TCP).
root@controlnode:/etc/rsyslog.d# cat kubernetes.conf

$ModLoad imfile

$InputFileName /var/log/audit/audit.log

$InputFileTag audit:

$InputFileStateFile stat-audit

$InputRunFileMonitor

$InputFileMaxMessageSize 16384

if $programname == 'audit' then @@192.168.0.54:514
The first line of defense is monitoring the kube-apiserver itself. The kube-apiserver is responsible for authenticating and validating a request and retrieving and updating the data in the ETCD data store. ETCD is a distributed database where all the information related to the cluster is stored in key-value format.
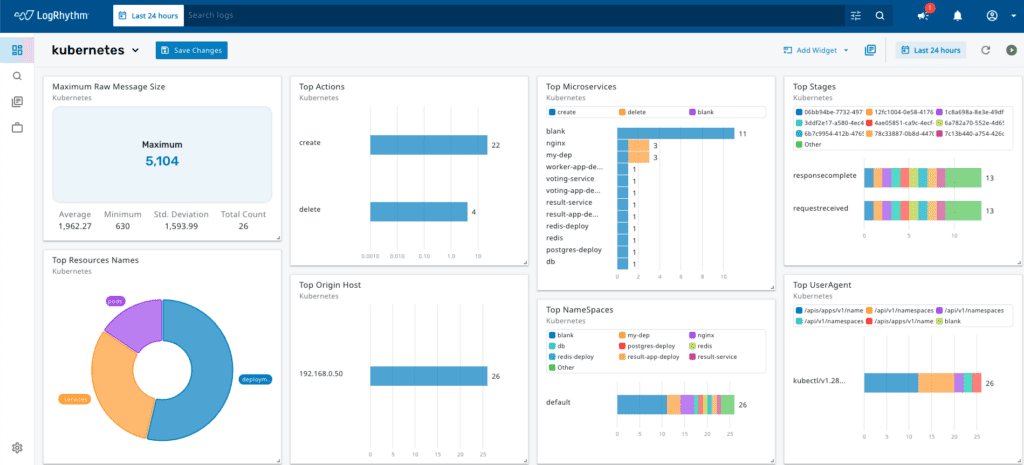
Kubernetes audit logs can get big — sometimes more than 5,000 bytes. LogRhythm Axon is a flexible solution that handles these large logs effortlessly and automatically organizes an incredible amount of information to help you understand the data.
Dashboard and Visualizations for Monitoring Kubernetes Activity
Even when the logs are quite complex, LogRhythm Axon can easily make sense of them, turning overwhelming amounts of data into meaningful insights. It’s like having a superhero assistant that ensures you easily find important information without getting lost!
Check out this example below. The LogRhythm Axon Dashboard shows a deployment of pods, deployment and services created by Kubernetes-admin using kubectl command line utility which is used to interact with the Kubernetes cluster.
For additional information on Kubernetes audit logs, LogRhythm Axon, and how a cloud-native SIEM platform can help you in your Kubernetes efforts, contact our team for a free demo. Let’s talk about your security needs and how we can help!
如有侵权请联系:admin#unsafe.sh
