
Ghidra, is a software reverse engineering (SRE) suite of tools developed by NSA’s Research Direct 2019-3-7 11:36:38 Author: 0xeb.net(查看原文) 阅读量:23 收藏
Ghidra, is a software reverse engineering (SRE) suite of tools developed by NSA’s Research Directorate in support of the Cybersecurity mission. It was released recently and I became curious about it and wanted to check it out.
I have not researched to see if someone else did a similar overview article or not, however, I am writing this article for myself and those who don’t want to run Ghidra themselves and just want to learn a bit about it.
I know that it is unfair to compare Ghidra to IDA Pro, but I cannot help it: I am a long time user of IDA Pro and it is my only point of reference when it comes to reverse engineering tools.
This article is going to be long and will contain lots of screenshots. I just started playing with Ghidra and therefore, I might be wrong or might be presenting inaccurate or incomplete information so please excuse me ahead of time.
Table of contents
What is Ghidra

Ghidra is a software reverse engineering (SRE) framework that includes a suite of full-featured, high-end software analysis tools that enable users to analyze compiled code on a variety of platforms including Windows, Mac OS, and Linux. Capabilities include disassembly, assembly, decompilation, graphing, and scripting, along with hundreds of other features. Ghidra supports a wide variety of process instruction sets and executable formats and can be run in both user-interactive and automated modes. Users may also develop their own Ghidra plug-in components and/or scripts using the exposed API.
Files structure overview
I ran the tree command on the unpacked Ghidra installation archive. Here’s the output:
├───Configurations
│   └───Public_Release
│       ├───data
│       └───lib
├───Extensions
├───Features
│   ├───Base
│   │   ├───data
│   │   │   ├───formats
│   │   │   ├───parserprofiles
│   │   │   ├───stringngrams
│   │   │   ├───symbols
│   │   │   │   ├───win32
│   │   │   │   └───win64
│   │   │   └───typeinfo
│   │   │       ├───generic
│   │   │       ├───mac_10.9
│   │   │       └───win32
│   │   │           └───msvcrt
│   │   ├───ghidra_scripts
│   │   └───lib
│   ├───BytePatterns
│   │   ├───data
│   │   │   └───test
│   │   ├───ghidra_scripts
│   │   └───lib
│   ├───ByteViewer
│   │   ├───data
│   │   └───lib
│   ├───DebugUtils
│   │   └───lib
│   ├───Decompiler
│   │   ├───ghidra_scripts
│   │   ├───lib
│   │   └───os
│   │       ├───linux64
│   │       ├───osx64
│   │       └───win64
│   ├───DecompilerDependent
│   │   ├───data
│   │   └───lib
│   ├───FileFormats
│   │   ├───data
│   │   │   ├───android
│   │   │   ├───crypto
│   │   │   └───languages
│   │   │       └───Dalvik
│   │   ├───ghidra_scripts
│   │   └───lib
│   ├───FunctionGraph
│   │   ├───data
│   │   └───lib
│   ├───FunctionGraphDecompilerExtension
│   │   └───lib
│   ├───FunctionID
│   │   ├───data
│   │   ├───ghidra_scripts
│   │   └───lib
│   ├───GhidraServer
│   │   ├───data
│   │   │   └───yajsw-stable-12.12
│   │   │       ├───doc
│   │   │       ├───lib
│   │   │       │   ├───core
│   │   │       │   │   ├───commons
│   │   │       │   │   ├───jna
│   │   │       │   │   ├───netty
│   │   │       │   │   └───yajsw
│   │   │       │   └───extended
│   │   │       │       ├───abeille
│   │   │       │       ├───commons
│   │   │       │       ├───cron
│   │   │       │       ├───glazedlists
│   │   │       │       ├───groovy
│   │   │       │       ├───jgoodies
│   │   │       │       ├───keystore
│   │   │       │       ├───regex
│   │   │       │       ├───velocity
│   │   │       │       ├───vfs-dbx
│   │   │       │       ├───vfs-webdav
│   │   │       │       └───yajsw
│   │   │       └───templates
│   │   ├───lib
│   │   └───os
│   │       ├───linux64
│   │       ├───win32
│   │       └───win64
│   ├───GnuDemangler
│   │   ├───ghidra_scripts
│   │   └───lib
│   ├───GraphFunctionCalls
│   │   └───lib
│   ├───MicrosoftCodeAnalyzer
│   │   └───lib
│   ├───MicrosoftDemangler
│   │   └───lib
│   ├───MicrosoftDmang
│   │   └───lib
│   ├───PDB
│   │   ├───lib
│   │   ├───os
│   │   │   └───win64
│   │   └───src
│   │       └───pdb
│   │           ├───cpp
│   │           └───headers
│   ├───ProgramDiff
│   │   └───lib
│   ├───Python
│   │   ├───data
│   │   │   └───jython-2.7.1
│   │   ├───ghidra_scripts
│   │   └───lib
│   ├───Recognizers
│   │   └───lib
│   ├───SourceCodeLookup
│   │   └───lib
│   └───VersionTracking
│       ├───data
│       ├───ghidra_scripts
│       └───lib
├───Framework
│   ├───DB
│   │   └───lib
│   ├───Demangler
│   │   └───lib
│   ├───Docking
│   │   ├───data
│   │   └───lib
│   ├───FileSystem
│   │   └───lib
│   ├───Generic
│   │   ├───data
│   │   └───lib
│   ├───Graph
│   │   └───lib
│   ├───Help
│   │   └───lib
│   ├───Project
│   │   ├───data
│   │   └───lib
│   ├───SoftwareModeling
│   │   ├───data
│   │   │   └───languages
│   │   └───lib
│   └───Utility
│       └───lib
├───Processors
│   ├───6502
│   │   └───data
│   │       └───languages
│   ├───68000
│   │   ├───data
│   │   │   ├───languages
│   │   │   └───manuals
│   │   └───lib
│   ├───6805
│   │   └───data
│   │       └───languages
│   ├───8051
│   │   ├───data
│   │   │   ├───languages
│   │   │   │   └───old
│   │   │   └───manuals
│   │   └───ghidra_scripts
│   ├───8085
│   │   └───data
│   │       └───languages
│   ├───AARCH64
│   │   ├───data
│   │   │   ├───languages
│   │   │   └───patterns
│   │   └───lib
│   ├───ARM
│   │   ├───data
│   │   │   ├───languages
│   │   │   │   └───old
│   │   │   ├───manuals
│   │   │   └───patterns
│   │   └───lib
│   ├───Atmel
│   │   ├───data
│   │   │   ├───languages
│   │   │   └───manuals
│   │   └───lib
│   ├───CR16
│   │   └───data
│   │       ├───languages
│   │       └───manuals
│   ├───DATA
│   │   ├───data
│   │   │   └───languages
│   │   ├───ghidra_scripts
│   │   └───lib
│   ├───JVM
│   │   ├───data
│   │   │   ├───languages
│   │   │   └───manuals
│   │   └───lib
│   ├───MIPS
│   │   ├───data
│   │   │   ├───languages
│   │   │   ├───manuals
│   │   │   └───patterns
│   │   └───lib
│   ├───PA-RISC
│   │   └───data
│   │       ├───languages
│   │       ├───manuals
│   │       └───patterns
│   ├───PIC
│   │   ├───data
│   │   │   ├───languages
│   │   │   └───manuals
│   │   ├───ghidra_scripts
│   │   └───lib
│   ├───PowerPC
│   │   ├───data
│   │   │   ├───languages
│   │   │   │   └───old
│   │   │   ├───manuals
│   │   │   └───patterns
│   │   └───lib
│   ├───Sparc
│   │   ├───data
│   │   │   ├───languages
│   │   │   ├───manuals
│   │   │   └───patterns
│   │   └───lib
│   ├───TI_MSP430
│   │   └───data
│   │       ├───languages
│   │       └───manuals
│   ├───Toy
│   │   ├───data
│   │   │   └───languages
│   │   │       └───old
│   │   │           └───v01stuff
│   │   └───lib
│   ├───x86
│   │   ├───data
│   │   │   ├───languages
│   │   │   │   └───old
│   │   │   ├───manuals
│   │   │   └───patterns
│   │   └───lib
│   └───Z80
│       └───data
│           ├───languages
│           └───manuals
└───Test
    └───IntegrationTest
        └───lib
One can see that this project is pretty organized. Digging deeper, I noticed that Ghidra already includes source code for various components:
-
-
- There are lots of source code files if you search for `*-src.zip`.
- PDB plugin source code
- 200+ Java scripts in source form
- etc.
-
I mentioned the topic of source code because at the time of writing this article, Ghidra’s GitHub repository still does not contain the source code and it reads:
This repository is a placeholder for the full open source release. Be assured efforts are under way to make the software available here. In the meantime, enjoy using Ghidra on your SRE efforts, developing your own scripts and plugins, and perusing the over-one-million-lines of Java and Sleigh code released within the initial public release. The release can be downloaded from our project homepage. Please consider taking a look at our contributor guide to see how you can participate in this open source project when it becomes available.
Processor modules
At the time of writing, Ghidra supports the following processor modules:
- 6502
- 68000
- 6805
- 8051
- 8085
- AARCH64
- ARM
- Atmel
- CR16
- DATA
- JVM
- MIPS
- PA-RISC
- PIC
- PowerPC
- Sparc
- TI_MSP430
- Toy
- x86
- Z80
They are located in C:\ghidra_9.0\Ghidra\Processors.
The processor modules seem to be data driven. There are some plugins/extensions aspect to them written and implemented in Java.
For instance, you can find some source code components of the x86 module in here: C:\ghidra_9.0\Ghidra\Processors\x86\lib\x86-src.zip.
The programmable part of a processor module contains things like ‘relocation decoders’, ‘file format decoders’, ‘analysis plugins’, etc.
├───app
│ ├───plugin
│ │ └───core
│ │ └───analysis
│ └───util
│ └───bin
│ └───format
│ ├───coff
│ │ └───relocation
│ └───elf
│ ├───extend
│ └───relocation
└───feature
└───fid
└───hash
Interestingly enough, processor modules have reference to the corresponding processor module in external tools (namely IDA Pro):
<language_definitions>

  <language processor="6502"
            endian="little"
            size="16"
            variant="default"
            version="1.0"
            slafile="6502.sla"
            processorspec="6502.pspec"
            id="6502:LE:16:default">
    <description>6502 Microcontroller Family</description>
    <compiler name="default" spec="6502.cspec" id="default"/>
    <external_name tool="IDA-PRO" name="m6502"/>
  <external_name tool="IDA-PRO" name="m65c02"/>
  </language>
Ghidra is feature full. It includes a powerful code browser, a graph viewer, a decompiler, hundreds of scripts, various search facilities, undo/redo support, a server for collaborative work, program diffing tools, etc.
Since Ghidra is huge, I won’t be able to cover every single feature, instead I will focus on the most important and useful ones that a seasoned reverse engineer will find fundamental.
Project management
Everything is a project in Ghidra. Unlike IDA, you don’t start your reverse engineering session with an input file, instead you start by creating a project. On the first run, there are no projects and you are presented with this dialog:

In this article, I will be reverse engineering my open source Wizmo tool that can be found here. Please grab the binaries if you want to use Ghidra and follow along.
Start by creating a project called “Wizmo” and by importing the “WizmoConsole.exe” program:

After importing the file, you are presented with the import results summary dialog:

After you press “OK”, you get to see the code browser window and are asked whether you want to start analyzing the file:

You can always analyze or re-analyze the file later from the “Analysis” menu:

You can also check the properties of the imported file:

You can import as many files as you want. Normally, the files you import into the project should have a logical relationship among themselves. For example, the main EXE and its DLLs.

In this example above, I imported unrelated files. Later, we will also learn that it is possible to create links from one imported file to another by editing the external functions path. For example WizmoConsole.exe imports from user32.dll, therefore we can link the imported functions in WizmoConsole to jump directly into user32.dll. This feature is what really constitutes a project. The concept of projects is not yet supported by IDA Pro.
The code browser
The code browser can be compared to IDA’s main interface. The code browser hosts all the visual elements of Ghidra:
- The main menus
- The disassembly view
- Symbol tree
- Program trees
- Strings view
- Data types manager
- Decompiler view
- etc.

The program disassembly listing is highly customizable. Just press on the “Edit the listing fields” button (as indicated by the cursor) to see all the customization options:

Click and drag the fields to re-arrange the visual elements in the disassembly listing (disasm view) window. This advanced visual customization is also not available in IDA Pro.
The code browser also allows you to show additional side information such as the program overview and the entropy:
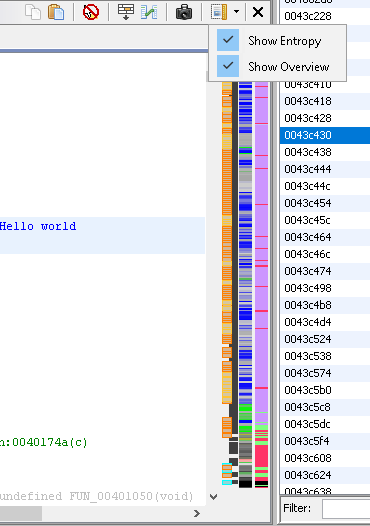
Inside the code browser disassembly listing, you can press “G” to jump to an address or a label:

Or simply rename a function or label:

You can also right-click on a number in the listing to convert it to another numerical representation:

To view information about an instruction in the code browser, just right click and select “Instruction Info”:

On the same topic of disassembly listing customization, you can convert certain operands to enum constants:

Ghidra sports a nice data type chooser that will help you either type the full type name or choose it visually.
The symbol tree
The symbol tree window lets you see all the symbols in the program, such as the exports, imports, classes, functions, labels, etc.

Here I am exploring the imports of USER32.dll:

As you explore the imported entry, you can double-click to jump to it in the code browser. Additionally, if you are not satisfied with the prototype of the imported entry, you can always edit it:


Earlier, I mentioned that you can link an external function to another imported file. Since we know that all those functions come from user32.dll, we can link those functions to the imported file in the project:


 Do you want to master Batch Files programming? Look no further, the Batchography is the right book for you.
Available in print or e-book editions from Amazon.
The decompiler
The decompiler is a neat and most welcome feature in Ghidra:

You can toggle the decompiler view from the Window menu. The decompiler view synchronizes with the disassembly listing. Therefore, when you navigate in the decompiler view, you will see the corresponding disassembly lines in the listing window.
Like IDA’s Hex-Rays decompiler plugin, Ghidra’s decompiler is interactive and customizable:
- Rename functions
- Add comments
- Change function prototypes
- Change variable names and types
- etc.
Here for instance is the full (manually cleaned up) decompilation of the CWizmo::CWizmo constructor:

I had to create a new custom structure first using the “Data Types” window and selecting “New -> Structure”:

I then populated the new structure fields:

If you don’t want to create the custom structures by hand, you can also parse a C header file:

The decompiler has a contextual popup menu:

– It lets you set comments in the decompiler listing:

– Change a decompiled function prototype:

– Change the prototype of a function argument:

– Modify the function’s return type, signature or run searches:

It is worthwhile noting that the function editor (toggled with the “F” hotkey) is as powerful as IDA’s function prototyping facilities. You can edit the arguments and specify custom storage (ala IDA’s __usercall) for them (stack, registers, etc.):

Some of the supported storage types for the x86 input file:

Apart from being an interactive decompiler, you have powerful searching features. For example, we can search for the usage of a given data type from the decompilation listing.
Here, we right-click on memset‘s last argument (0x2c, size_t) to look for all usages of the “size_t” type in all decompiled functions (very super handy for vulnerability research):

Right click and select: “Find Uses of size_t”

The result shows us all variables of type “size_t” being used.
Code patching and the hex viewer
Like IDA, Ghidra provides lots of functionality to patch code and then save the patched result. To patch an instruction, just right click and select:

You will then be presented by an instruction editor / assembler:

If you prefer to patch the code like a l33t h4x0r from the hex-viewer, just toggle the hex view from the “Window/Bytes” menu:

Then make the bytes view editable:

You can now edit the program:

The hex viewer has a contextual menu that lets you copy the bytes for instance:

Like in IDA Pro, you can “load additional binaries” by selecting “Add to Program” from the File menu:


After selecting the file you want to add, you can specify additional loading options (block name, base address, etc.):

This is super useful for instance if you want to load shellcode and analyze it along your program:

The new code is then shown nicely in the code browser under its own block name.
No patching is complete without being exported / applied outside. Ghidra, like IDA, let’s you export your changes:

Export as a binary format. You will get a summary after a successful export:

If you compare both the original and the patched file, you should see the difference applied correctly:

etc.
Graph view
Ghidra, like IDA also sports a graph view. Combined with the facilities from the “Select” menu, the graph view becomes a powerful tool:

The “Select” menu:

– You can zoom in:

– You can also change the color of a basic block:

– Or collapse the contents of basic blocks into a single block with a label of your choosing:

– You can also play with various visual aids:

– Last but not least, you can select “Full screen” on a given basic block to inspect it better:

Searching features
Ghidra ships with a wide variety of searching functionality under the “Search” menu:

– You can search for address tables for example:

– You can equally search for scalars (ala “immediates value search” in IDA):

Once you find results:

– You can apply additional filters:

When you apply the filter, the search results are further refined:

If you want to look for certain instructions sequence, you can select one or more instructions from the code browser:

…then select “For Instruction Pattern ” from the search menu to execute the search:

Scripting features
No SRE tool is complete without powerful scripting facilities (select scripting from the “Window/Script manager” menu). Ghidra, out of the box, ships with 200+ scripts written in Java:
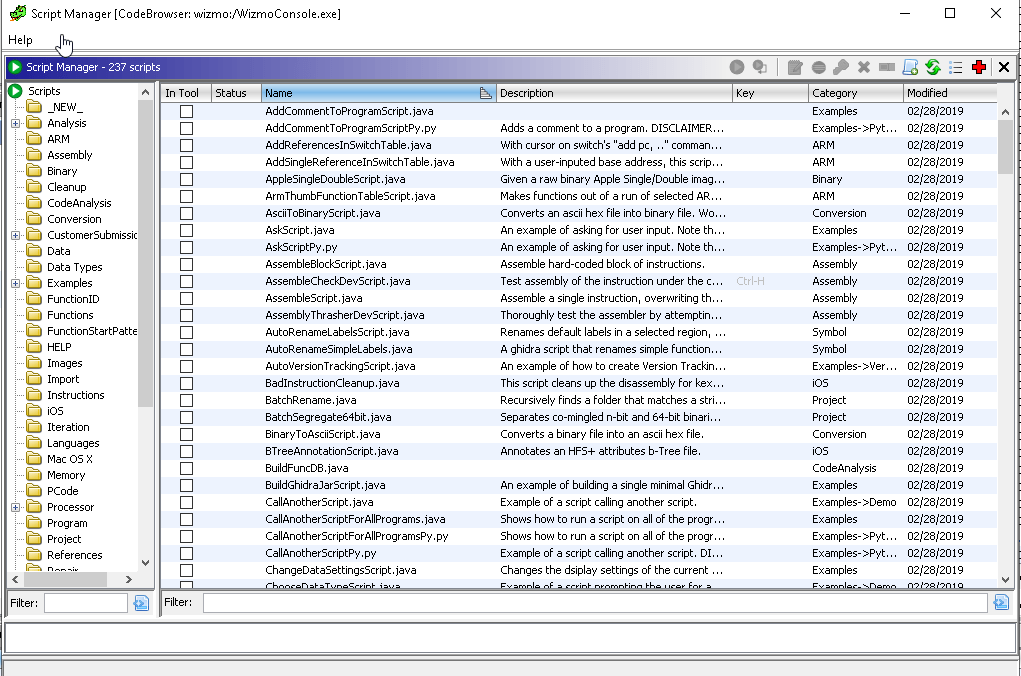
For example, the FindImagesScript.java script finds PNG and GIF images in the input file:

Those scripts use the Ghidra’s APIs:


If you don’t like Java, you can use Python (hosted with Jython) to write scripts:


Misc features
Ghidra has many others miscellaneous features worthwhile mentioning.
Let’s start with the cross referencing features.
You can ask Ghidra to compute the cross reference to and from almost any item (string, instruction, register, etc.).
Here for example, we are looking for cross references to a given string from the strings window:

With strings cross referencing, you can discover malicious strings or locate the code that refers / implements certain features (based on the string text you found).

Like in IDA, you can create xrefs manually:

Another feature that can be compared to IDA’s “Segments window” is the “Memory map” window:

In the memory map, you can see the program sections (if the input file has sections, like a PE or ELF file).
Additionally, you can create new sections manually:

Options
Almost everything can be configured in Ghidra through the options facilities:
Other screenshots
Here are some miscellaneous screenshots from Ghidra:
After having played with Ghidra’s UI for a couple of hours, I found it useful and capable but that won’t be enough for me to make the switch from IDA Pro to Ghidra:
- I have been using IDA Pro for 22+ years. It is not easy to throw away this experience and start learning a new tool.
- Having worked with Hex-Rays and contributed to many features in IDA, I know its SDK and internals pretty well and I know nothing about Ghidra’s
- If I want to learn Ghidra’s APIs, I can. However, there are no business justifications yet.
- Debuggers: IDA has so many debuggers
- They are my best features in IDA Pro. Without debuggers it is hard for me to switch away from IDA.
- Customer support: the best in the world
- Hex-Rays customer support has spoiled me over the years. You cannot expect the same level of responsiveness and professionalism from any other company. And yes, Amazon Customer service does not even come close to Hex-Ray’s.
- IDA is written in C++
- IDA, at least on the Windows Platform, feels much neater and faster than Ghidra
- A higher degree of interactivity
- From my little interaction with Ghidra, IDA still has lots of interactive features and ways to modify the disassembly listing and the Hex-Rays decompiler output.
- IDA is highly programmable and scriptable
- Yes, Ghidra is programmable and scriptable
- But in my opinion, IDA still beats that:
- Write plugins / processor modules / file loaders in C++, Python, JavaScript, OCaml your own language?
- IDA supports way more processor modules and file loaders (file formats). If you do the multiplication of processor_modules * file_loaders, IDA supports 1200+ different file inputs!
Finally, I personally won’t use Ghidra since it is not yet as powerful as IDA or its decompiler. When Ghidra is open sourced and adopted by the community, we will see which SRE tool remains the king: Binary Ninja, radare, IDA Pro, Hopper, etc.?
 You might also like:
如有侵权请联系:admin#unsafe.sh