06/03/2024
9 min read

Cloudflare’s logging pipeline is one of the largest data pipelines that Cloudflare has, serving millions of log events per second globally, from every server we run. Recently, we undertook a project to migrate the underlying systems of our logging pipeline from syslog-ng to OpenTelemetry Collector and in this post we want to share how we managed to swap out such a significant piece of our infrastructure, why we did it, what went well, what went wrong, and how we plan to improve the pipeline even more going forward.
Background
A full breakdown of our existing infrastructure can be found in our previous post An overview of Cloudflare's logging pipeline, but to quickly summarize here:
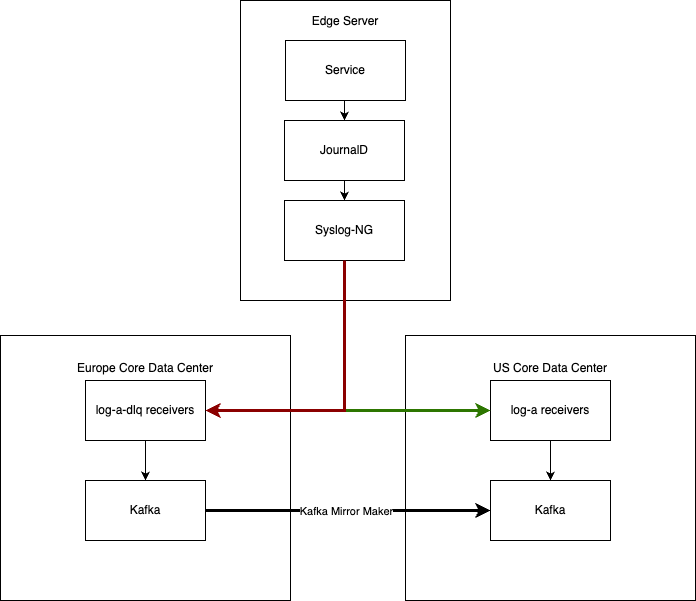
- We run a syslog-ng daemon on every server, reading from the local systemd-journald journal, and a set of named pipes.
- We forward those logs to a set of centralized “log-x receivers”, in one of our core data centers.
- We have a dead letter queue destination in another core data center, which receives messages that could not be sent to the primary receiver, and which get mirrored across to the primary receivers when possible.

The goal of this project was to replace those syslog-ng instances as transparently as possible. That means we needed to implement all these behaviors as precisely as possible, so that we didn’t need to modify any downstream systems.
There were a few reasons for wanting to make this shift, and enduring the difficulties of overhauling such a large part of our infrastructure:
- syslog-ng is written in C, which is not a core competency of our team. While we have made upstream contributions to the project in the past, and the experience was great, having the OpenTelemetry collector in Go allows much more of our team to be able to contribute improvements to the system.
- Building syslog-ng against our internal Post-Quantum cryptography libraries was difficult, due to having to maintain an often brittle C build chain, whereas our engineering teams have optimized the Go build model to make this as simple as possible.
- OpenTelemetry Collectors have built in support for Prometheus metrics, which allows us to gather much deeper levels of telemetry data around what the collectors are doing, and surface these insights as “meta-observability” to our engineering teams.
- We already use OpenTelemetry Collectors for some of our tracing infrastructure, so unifying onto one daemon rather than having separate collectors for all our different types of telemetry reduces the cognitive load on the team.
The Migration Process
What we needed to build
While the upstream contrib repository contains a wealth of useful components, all packaged into its own distribution, it became clear early on that we would need our own internal components. Having our own internal components would require us to build our own distribution, so one of the first things we did was turn to OCB (OpenTelemetry Collector Builder) to provide us a way to build an internal distribution of an OpenTelemetry Collector. We eventually ended up templating our OCB configuration file to automatically include all the internal components we have built, so that we didn’t have to add them manually.
In total, we built four internal components for our initial version of the collector.
cfjs1exporter
Internally, our logging pipeline uses a line format we call “cfjs1”. This format describes a JSON encoded log, with two fields: a format field, that decides the type of the log, and a “wrapper” field which contains the log body (which is a structured JSON object in and of itself), with a field name that changes depending on the format field. These two fields decide which Kafka topic our receivers will end up placing the log message in.
Because we didn’t want to make changes to other parts of the pipeline, we needed to support this format in our collector. To do this, we took inspiration from the contrib repository’s syslogexporter, building our cfjs1 format into it.
Ultimately, we would like to move towards using OTLP (OpenTelemetry Protocol) as our line format. This would allow us to remove our custom exporter, and utilize open standards, enabling easier migrations in the future.
fileexporter
While the upstream contrib repo does have a file exporter component, it only supports two formats: JSON and Protobuf. We needed to support two other formats, plain text and syslog, so we ended up forking the file exporter internally. Our plain text formatter simply outputs the body of the log message into a file, with newlines as a delimiter. Our syslog format outputs RFC 5424 formatted syslog messages into a file.
The other feature we implemented on our internal fork was custom permissions. The upstream file exporter is a bit of a mess, in that it actually has two different modes of operation – a standard mode, not utilizing any of the compression or rotation features, and a more advanced mode which uses those features. Crucially, if you want to use any of the rotation features, you end up using lumberjack, whereas without those features you use a more native file handling. This leads to strange issues where some features of the exporter are supported in one mode, but not the other. In the case of permissions, the community seems open to the idea in the native handling, but lumberjack seems against the idea. This dichotomy is what led us to implement it ourselves internally.
Ultimately, we would love to upstream these improvements should the community be open to them. Having support for custom marshallers (https://github.com/open-telemetry/opentelemetry-collector-contrib/issues/30331) would have made this a bit easier, however it’s not clear how that would work with OCB. Either that, or we could open source them in the Cloudflare organization, but we would love to remove the need to maintain our own fork in the future.
externaljsonprocessor
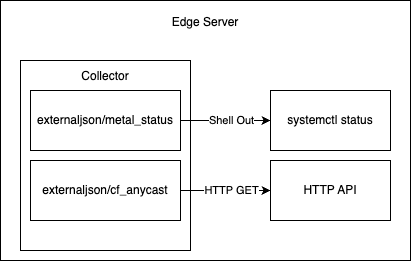
We want to set the value of an attribute/field that comes from external sources: either from an HTTP endpoint or an output from running a specific command. In syslog-ng, we have a sidecar service that generates a syslog-ng configuration to achieve this. In replacing syslog-ng with our OpenTelemetry Collector, we thought it would be easier to implement this feature as a custom component of our collector instead.

To that end, we implemented an “external JSON processor”, which is able to periodically query external data sources and add those fields to all the logs that flow through the processor. Cloudflare has many internal tools and APIs, and we use this processor to fetch data like the status of a data center, or the status of a systemd unit. This enables our engineers to have more filtering options, such as to exclude logs from data centers that are not supposed to receive customer traffic, or servers that are disabled for maintenance. Crucially, this allows us to update these values much faster than the standard three-hour cadence of other configuration updates through salt, allowing more rapid updates to these fields that may change quickly as we operate our network.
ratelimit processor
The last component we needed to implement was a replacement for the syslog-ng ratelimit filter, also contributed by us upstream. The ratelimit filter allows applying rate limits based on a specific field of a log message, dropping messages that exceed some limit (with an optional burst limit). In our case, we apply rate limits over the service field, ensuring that no individual service can degrade the log collection for any other.
While there has been some upstream discussion of similar components, we couldn’t find anything that explicitly fit our needs. This was especially true when you consider that in our case the data loss during the rate limiting process is intentional, something that might be hard to sell when trying to build something more generally applicable.
How we migrated
Once we had an OpenTelemetry Collector binary, we had to deploy it. Our deployment process took two forks: Deploying to our core data centers, and deploying to our edge data centers. For those unfamiliar, Cloudflare’s core data centers contain a small number of servers with a very diverse set of workloads, from Postgresql, to ElasticSearch, to Kubernetes, and everything in between. Our edge data centers, on the other hand, are much more homogenous. They contain a much larger number of servers, each one running the same set of services.
Both edge and core use salt to configure the services running on their servers. This meant that the first step was to write salt states that would install the OpenTelemetry collector, and write the appropriate configurations to disk. Once we had those in place, we also needed to write some temporary migration pieces that would disable syslog-ng and start the OpenTelemetry collector, as well as the inverse in the case of a roll back.
For the edge data centers, once we had a set of configurations written, it mostly came down to rolling the changes out gradually across the edge servers. Because edge servers run the same set of services, once we had gained confidence in our set of configurations, it became a matter of rolling out the changes slowly and monitoring the logging pipelines along the way. We did have a few false starts here, and needed to instrument our cfjs1exporter a bit more to work around issues surrounding some of our more niche services and general Internet badness which we’ll detail below in our lessons learned.
The core data centers required a more hands-on approach. Many of our services in core have custom syslog-ng configurations. For example, our Postgresql servers have custom handling for their audit logs, and our Kubernetes servers have custom handling for contour ingress and error logs. This meant that each role with a custom config had to be manually onboarded, with extensive testing on the designated canary nodes of each role to validate the configurations.
Lessons Learned
Failover
At Cloudflare, we regularly schedule chaos testing on our core data centers which contain our centralized log receivers. During one of these chaos tests, our cfjs1 exporter did not notice that it could not send to the primary central logging server. This caused our collector to not failover to the secondary central logging server and its log buffer to fill up, which resulted in the collector failing to consume logs from its receivers. This is not a problem with journal receivers since logs are buffered by journald before they get consumed by the collector, but it is a different case with named pipe receivers. Due to this bug, our collectors stopped consuming logs from named pipes, and services writing to these named pipes started blocking threads waiting to write to them. Our syslog-ng deployment solved this issue using a monit script to periodically kill the connections between syslog-ng and the central receivers, however we opted to solve this more explicitly in our exporter by building in much tighter timeouts, and modifying the upstream failover receiver to better respond to these partial failures.
Cutover delays
As we’ve previously blogged about, at Cloudflare, we use Nomad for running dynamic tasks in our edge data centers. We use a custom driver to run containers and this custom driver handles the shipping of logs from the container to a named pipe.
We did the migration from syslog-ng to OpenTelemetry Collectors while servers were live and running production services. During the migration, there was a gap when syslog-ng was stopped by our configuration management and our OpenTelemetry collector was started on the server. This gap caused the logs in the named pipe to not get consumed and similar to the previous named pipe, the services writing to the named pipe receiver in blocking mode got affected. Similar to NGINX and Postgresql, Cloudflare’s driver for Nomad also writes logs to the named pipe driver in blocking mode. Because of this delay, the driver timed out sending logs and rescheduled the containers.
We ultimately caught this pretty early on in testing, and changed our approach to the rollout. Instead of using Salt to separately stop syslog-ng and start the collector, we instead used salt to schedule a systemd “one shot” service that simultaneously stopped syslog-ng and started the collector, minimizing the downtime between the two.
What’s next?
Migrating such a critical part of our infrastructure is never easy, especially when it has remained largely untouched for nearly half a decade. Even with the issues we hit during our rollout, migrating to an OpenTelemetry Collector unlocks so many more improvements to our logging pipeline going forward. With the initial deployment complete, there are a number of changes we’re excited to work on next, including:
- Better handling for log sampling, including tail sampling
- Better insights for our engineering teams on their telemetry production
- Migration to OTLP as our line protocol
- Upstreaming of some of our custom components
If that sounds interesting to you, we’re hiring engineers to come work on our logging pipeline, so please reach out!
We protect entire corporate networks, help customers build Internet-scale applications efficiently, accelerate any website or Internet application, ward off DDoS attacks, keep hackers at bay, and can help you on your journey to Zero Trust.
Visit 1.1.1.1 from any device to get started with our free app that makes your Internet faster and safer.
To learn more about our mission to help build a better Internet, start here. If you're looking for a new career direction, check out our open positions.
