Loading...
8 min read

Network engineers often find they need better visibility into their network’s traffic and operations while analyzing DDoS attacks or troubleshooting other traffic anomalies. These engineers typically have some high level metrics about their network traffic, but they struggle to collect essential information on the specific traffic flows that would clarify the issue. To solve this problem, Cloudflare has been piloting a cloud network flow monitoring product called Magic Network Monitoring that gives customers end-to-end visibility into all traffic across their network.
Today, Cloudflare is excited to announce that Magic Network Monitoring (previously called Flow Based Monitoring) is now generally available to all enterprise customers. Over the last year, the Cloudflare engineering team has significantly improved Magic Network Monitoring; we’re excited to offer a network services product that will help our customers identify threats faster, reduce vulnerabilities, and make their network more secure.
Magic Network Monitoring is automatically enabled for all Magic Transit and Magic WAN enterprise customers. The product is located at the account level of the Cloudflare dashboard and can be opened by navigating to “Analytics & Logs > Magic Monitoring”. The onboarding process for Magic Network Monitoring is self-serve, and all enterprise customers with access can begin configuring the product today.
Any enterprise customers without Magic Transit or Magic WAN that are interested in testing Magic Network Monitoring can receive access to the free version (with some limitations on traffic volume) by submitting a request to their Cloudflare account team or filling out this form to talk with an expert.
What is Magic Network Monitoring?
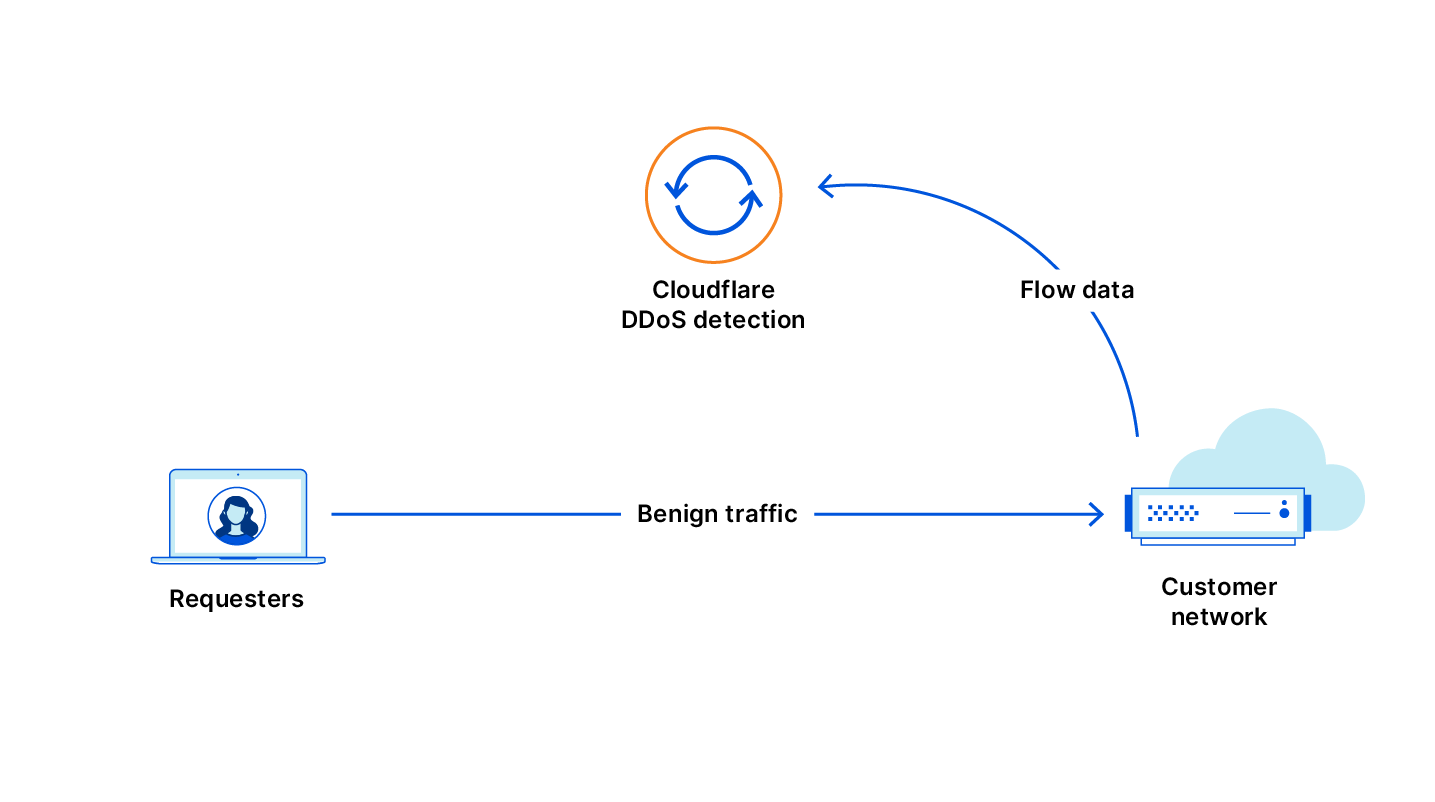
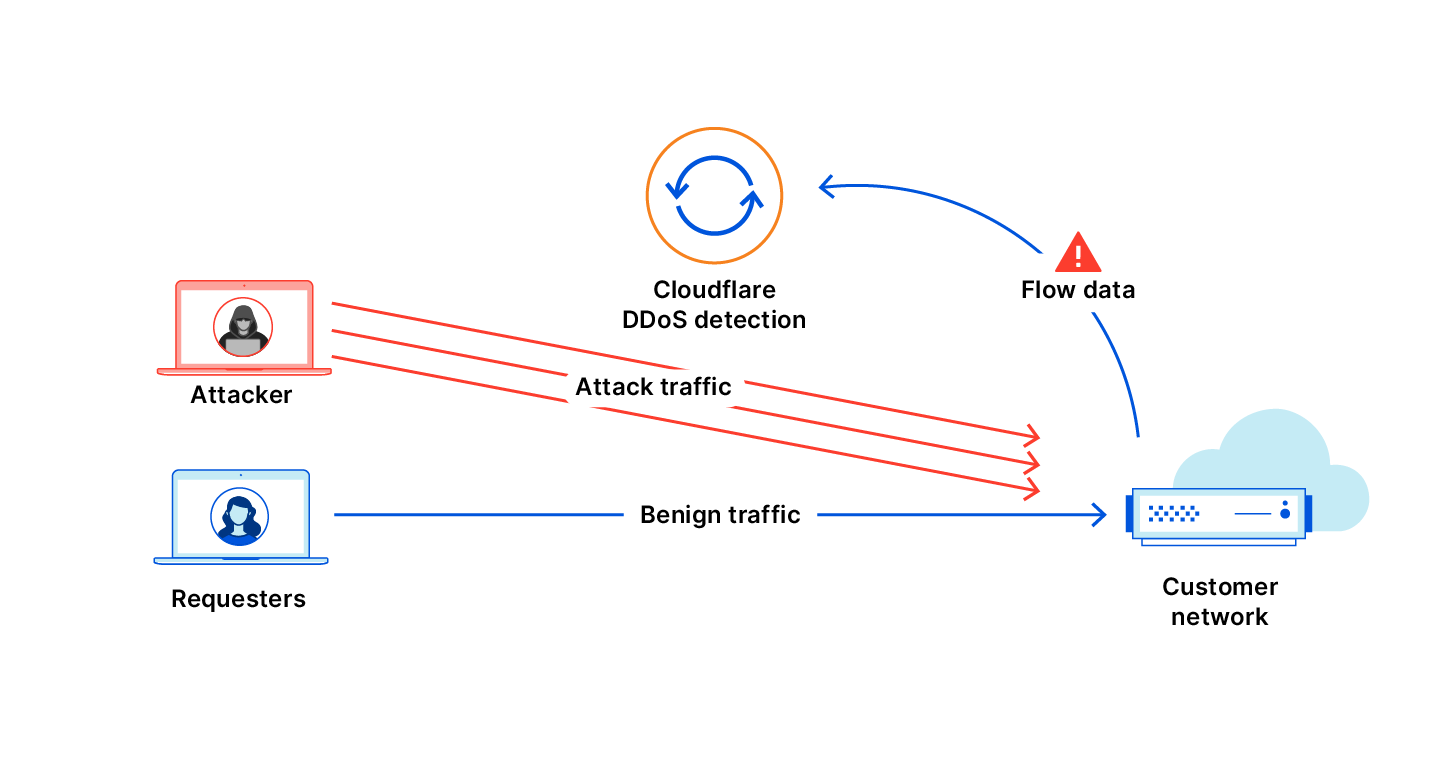
Magic Network Monitoring is a cloud network flow monitor. Network traffic flow refers to any stream of packets between one source and one destination with the same Internet protocol and set of ports. Customers can send network flow reports from their routers (or any other network flow generator) to a publicly available endpoint on Cloudflare’s anycast network, even if the traffic didn’t originally pass through Cloudflare’s network. Cloudflare analyzes the network flow data, then provides customers visibility into key network traffic metrics via an analytics dashboard. These metrics include: traffic volume (in bits or packets) over time, source IPs, destination IPs, ports, traffic protocols, and router IPs. Customers can also configure alerts to identify DDoS attacks and any other abnormal traffic volume activities.

Enterprise DDoS attack type detection
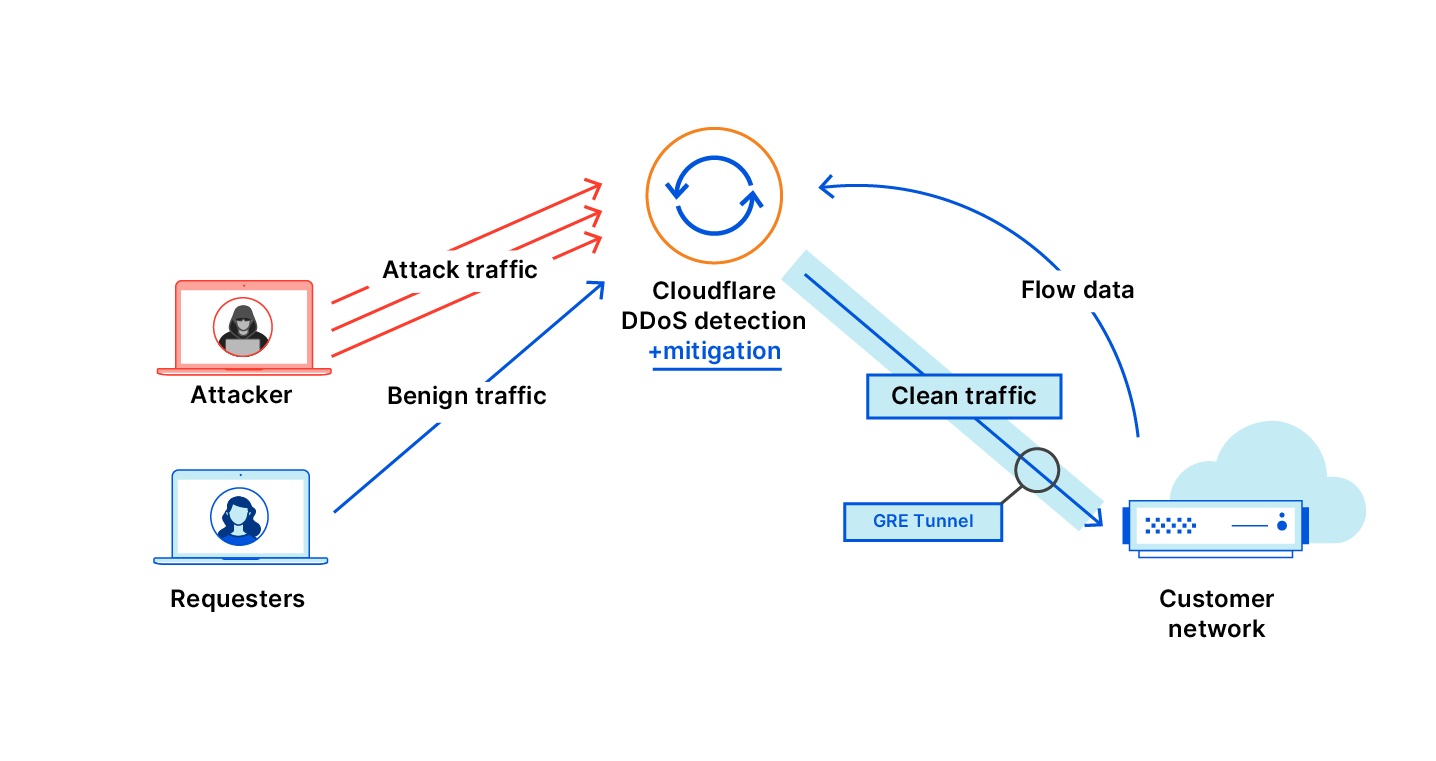
Magic Transit On Demand (MTOD) customers will experience significant traffic visibility benefits when using Magic Network Monitoring. Magic Transit is a network security solution that offers DDoS protection and traffic acceleration from every Cloudflare data center for on-premise, cloud-hosted, and hybrid networks. Magic Transit On Demand customers can activate Magic Transit for protection when a DDoS attack is detected.
In general, we noticed that some MTOD customers lacked the network visibility tools to quickly identify DDoS attacks and take the appropriate mitigation action. Now, MTOD customers can use Magic Network Monitoring to analyze their network data and receive an alert if a DDoS attack is detected.

Once a DDoS attack is detected, Magic Network Monitoring customers can choose to either manually or automatically enable Magic Transit to mitigate any DDoS attacks.

Enterprise network monitoring
Cloudflare’s Magic WAN and Cloudflare One customers can also benefit from using Magic Network Monitoring. Today, these customers have excellent visibility into the traffic they send through Cloudflare’s network, but sometimes they may lack visibility into traffic that isn’t sent through Cloudflare. This can include traffic that remains on a local network, or network traffic sent in between cloud environments. Magic WAN and Cloudflare One customers can add Magic Network Monitoring into their suite of product solutions to establish end-to-end network visibility across all traffic on their network.
A deep dive into network flow and network traffic sampling
Magic Network Monitoring gives customers better visibility into their network traffic by ingesting and analyzing network flow data.
The process starts when a router (or other network flow generation device) collects statistical samples of inbound and / or outbound packet data. These samples are collected by examining 1 in every X packets, where X is the sampling rate configured on the router. Typical sampling rates range from 1 in every 1,000 to 1 in every 4,000 packets. The ideal sampling rate depends on the traffic volume, traffic diversity, and the compute / memory power of your router’s hardware. You can read more about the recommended network flow sampling rate in Cloudflare’s MNM Developer Docs.
The sampled data is packaged into one of two industry standard formats for network flow data: NetFlow or sFlow. In NetFlow, the sampled packet data is grouped by different packet characteristics such as source / destination IP, port, and protocol. Each group of sampled packet data also includes a traffic volume estimate. In sFlow, the entire packet header is selected as the representative sample, and there isn’t any data summarization. As a result, sFlow is a richer data format and includes more details about network traffic than NetFlow data. Once either the NetFlow or sFlow data samples are collected, they’re sent to Magic Network Monitoring for analysis and alerting.

Why simple random sampling didn’t work for Magic Network Monitoring
Magic Network Monitoring has come a long way from its early access release one year ago. In particular, the Cloudflare engineering team invested significant time in improving the accuracy of the traffic volume estimations in MNM. In the early access version of Magic Network Monitoring, customers were unexpectedly reporting that their network traffic volume estimates were too high and didn’t match the expected value.
Magic Network Monitoring performs its own sampling of the NetFlow or sFlow data it receives, so it can effectively scale and manage the data ingested across Cloudflare’s global network. Increasing the accuracy of the traffic volume estimations was more difficult than expected, as the NetFlow or sFlow data parsed by MNM is already built on sampled packet data. This introduces multiple distinct layers of data sampling in the product’s analytics.
The first version of Magic Network Monitoring used random sampling where a random subset of network flow data with the same timestamp was selected to represent the traffic volume at that point in time. A characteristic of network flow data is that some samples are more significant than others and represent a greater volume of network traffic. In order to account for this significance, we can associate a weight with each sample based on the traffic volume it represents. Network flow data weights are always positive numbers, and they follow a long tail distribution. These data characteristics caused MNM’s random sampling to incorrectly estimate the traffic volume of a customer’s network. Customers would see false spikes in their traffic volume analytics when an outlying data sample from the long tail was randomly selected to be the representative of all traffic at that point in time.

Increasing accuracy with VarOpt reservoir sampling
To solve this problem, the Cloudflare engineering team implemented an alternative reservoir sampling technique called VarOpt. VarOpt is designed to collect samples from a stream of data when the length of the data stream is unknown (a perfect application for analyzing incoming network flow data). In the MNM implementation of VarOpt, we start with an empty reservoir of a fixed size that is filled with samples of network flow data. When the reservoir is full, and there is still new incoming network flow data, an old sample is randomly discarded from the reservoir and replaced with a new one.
After a certain number of samples have been observed, we calculate the traffic volume across all weighted samples in the reservoir, and that is the estimated traffic volume of a customer’s network flow at that point in time. Finally, the reservoir is emptied, and the VarOpt loop is restarted by filling the reservoir with the next set of the latest network flow samples.
The new VarOpt sampling method significantly increased the accuracy of the traffic volume estimations in Magic Network Monitoring, and solved our customer’s problems. These sampling improvements paved the way for general availability, and we’re excited to make accurate network flow analytics available to everyone.

Developer Docs and Discord Community
There are detailed Developer Docs for Magic Network Monitoring that explain the product’s features and outlines a step-by-step configuration guide for new customers. As you’re working through the Magic Network Monitoring documentation, please feel free to provide feedback by clicking the “Give Feedback” button in the top right corner of the Developer Docs.
We’ve also created a channel in Cloudflare’s Discord community built around debugging configuration problems, testing new features, and providing product feedback. You can follow this link to join the Cloudflare Discord server.
Free version
A free version of Magic Network Monitoring is available to all Enterprise customers on request to their Cloudflare account team. The free version is designed to enable Enterprise customers to quickly test and evaluate Magic Network Monitoring before purchasing Magic Transit, Magic WAN, or Cloudflare One. Enterprise customers can fully configure Magic Network Monitoring themselves by following the step-by-step onboarding guide in the product’s documentation. The free version has some limitations on the quantity of traffic that can be processed which are further outlined in the product’s documentation.
The free version of Magic Network Monitoring is also available to all Free, Pro, and Business plan Cloudflare customers via a closed beta. Anyone can request access to the free version by reading the free version documentation and filling out this form. Priority access is granted to anyone that joins Cloudflare’s Discord server and sends a message in the Magic Network Monitoring Discord channel.
Next steps that you can take today
Magic Network Monitoring is generally available, and all Magic Transit and Magic WAN customers have been automatically granted access to the product today. You can navigate to the product by going to the account level of the Cloudflare dashboard, then selecting “Analytics & Logs > Magic Monitoring”.
If you’re an enterprise customer without Magic Transit or Magic WAN, and you want to use Magic Network Monitoring to improve your traffic visibility, you can talk with an MNM expert today.
If you’re interested in using Magic Transit and Magic Network Monitoring for DDoS protection, you can request a demo of Magic Transit. If you want to use Magic WAN and Magic Network Monitoring together to establish end-to-end network traffic visibility, you can talk with a Magic WAN expert.
We protect entire corporate networks, help customers build Internet-scale applications efficiently, accelerate any website or Internet application, ward off DDoS attacks, keep hackers at bay, and can help you on your journey to Zero Trust.
Visit 1.1.1.1 from any device to get started with our free app that makes your Internet faster and safer.
To learn more about our mission to help build a better Internet, start here. If you're looking for a new career direction, check out our open positions.


