
2023-5-22 21:4:12 Author: www.sentinelone.com(查看原文) 阅读量:25 收藏
In our recent series on Mastering the Art of SOC Analysis, we explored how aspiring SOC Analysts can develop the skills needed in today’s complex threat environment. From learning the fundamentals like network and malware analysis to understanding cloud security and effective internal and external communication.
Essential to every SOC analyst is having the right tools and knowing how to use them to their full potential. Many SOCs worldwide partner with SentinelOne to maximize their resources and accelerate their ability to respond to incidents, hunt for threats and be more effective in securing the enterprise.
In this blog post, we share seven practical tips analysts can use within the SentinelOne console to power up day-to-day operations and find and stop attacks fast.
1. Leverage PowerQuery to Hunt for Abnormal Activities
In the past, SOC personnel needed to hunt for one IOC at a time, spending time trying to correlate it back to a meaningful activity. Today, analysts can be much more effective, and even spend time in proactive hunting with the help of PowerQuery.
Here are a few examples to understand the power of this.
A non-Windows process writes files to the temp directory
AgentOS = "windows" and objectType = "file" and FileFullName Contains Anycase "temp" and FileIsExecutable IS TRUE and SrcProcVerifiedStatus != "verified" AND SrcProcPublisher != "MICROSOFT WINDOWS"
Rundll or Regsvr executes a script
(SrcProcDisplayName = "Windows host process (Rundll32)" or SrcProcDisplayName = "Microsoft(C) Register Server") AND SrcProcCmdLine RegExp ".*(javascript|mshtml|runhtmlapplication).*"
Bat or cmd files are dropped directly to a temp folder
objectType = "file" and FileFullName containscis "\windows\temp" and (filefullname endswithcis ".bat" or filefullname endswithcis ".cmd" ) and FileFullName RegExp "windows\\temp\\[^\\\{\}]+$"
A non-Windows process injects to a Windows process
(SrcProcVerifiedStatus != "verified" AND SrcProcPublisher != "MICROSOFT WINDOWS" AND TgtProcVerifiedStatus = "verified" AND TgtProcPublisher != "MICROSOFT WINDOWS" and ObjectType = "cross_process") or (indicatorName = "RemoteInjection" AND (IndicatorMetadata Contains Anycase "lsass.exe" or IndicatorMetadata Contains Anycase "explorer.exe" or IndicatorMetadata Contains Anycase "svchost.exe"))
Cmd runs with /c and LOLBins for remote execution
SrcProcCmdLine contains anycase "cmd" and SrcProcCmdLine contains anycase "/c" and SrcProcCmdLine RegExp "(at|sc|schtasks|wmic)(\s|\"|\.exe).*cmd.*\s/c\s"
How It Helps
PowerQuery allows analysts to easily identify suspicious activities that require investigation. It can be as simple or as powerful as you need it to be, offering a rich set of commands to transform and manipulate data as well as many pre-built templates. See the built-in documentation for more examples and comprehensive help on PowerQuery.
2. Track Every Login Attempt in Your Environment
Basic queries can be used to view real-time login data. These simple queries can be modified and scaled to your environmental needs. The idea is to provide open-ended queries where analysts can then down-select as they see fit.
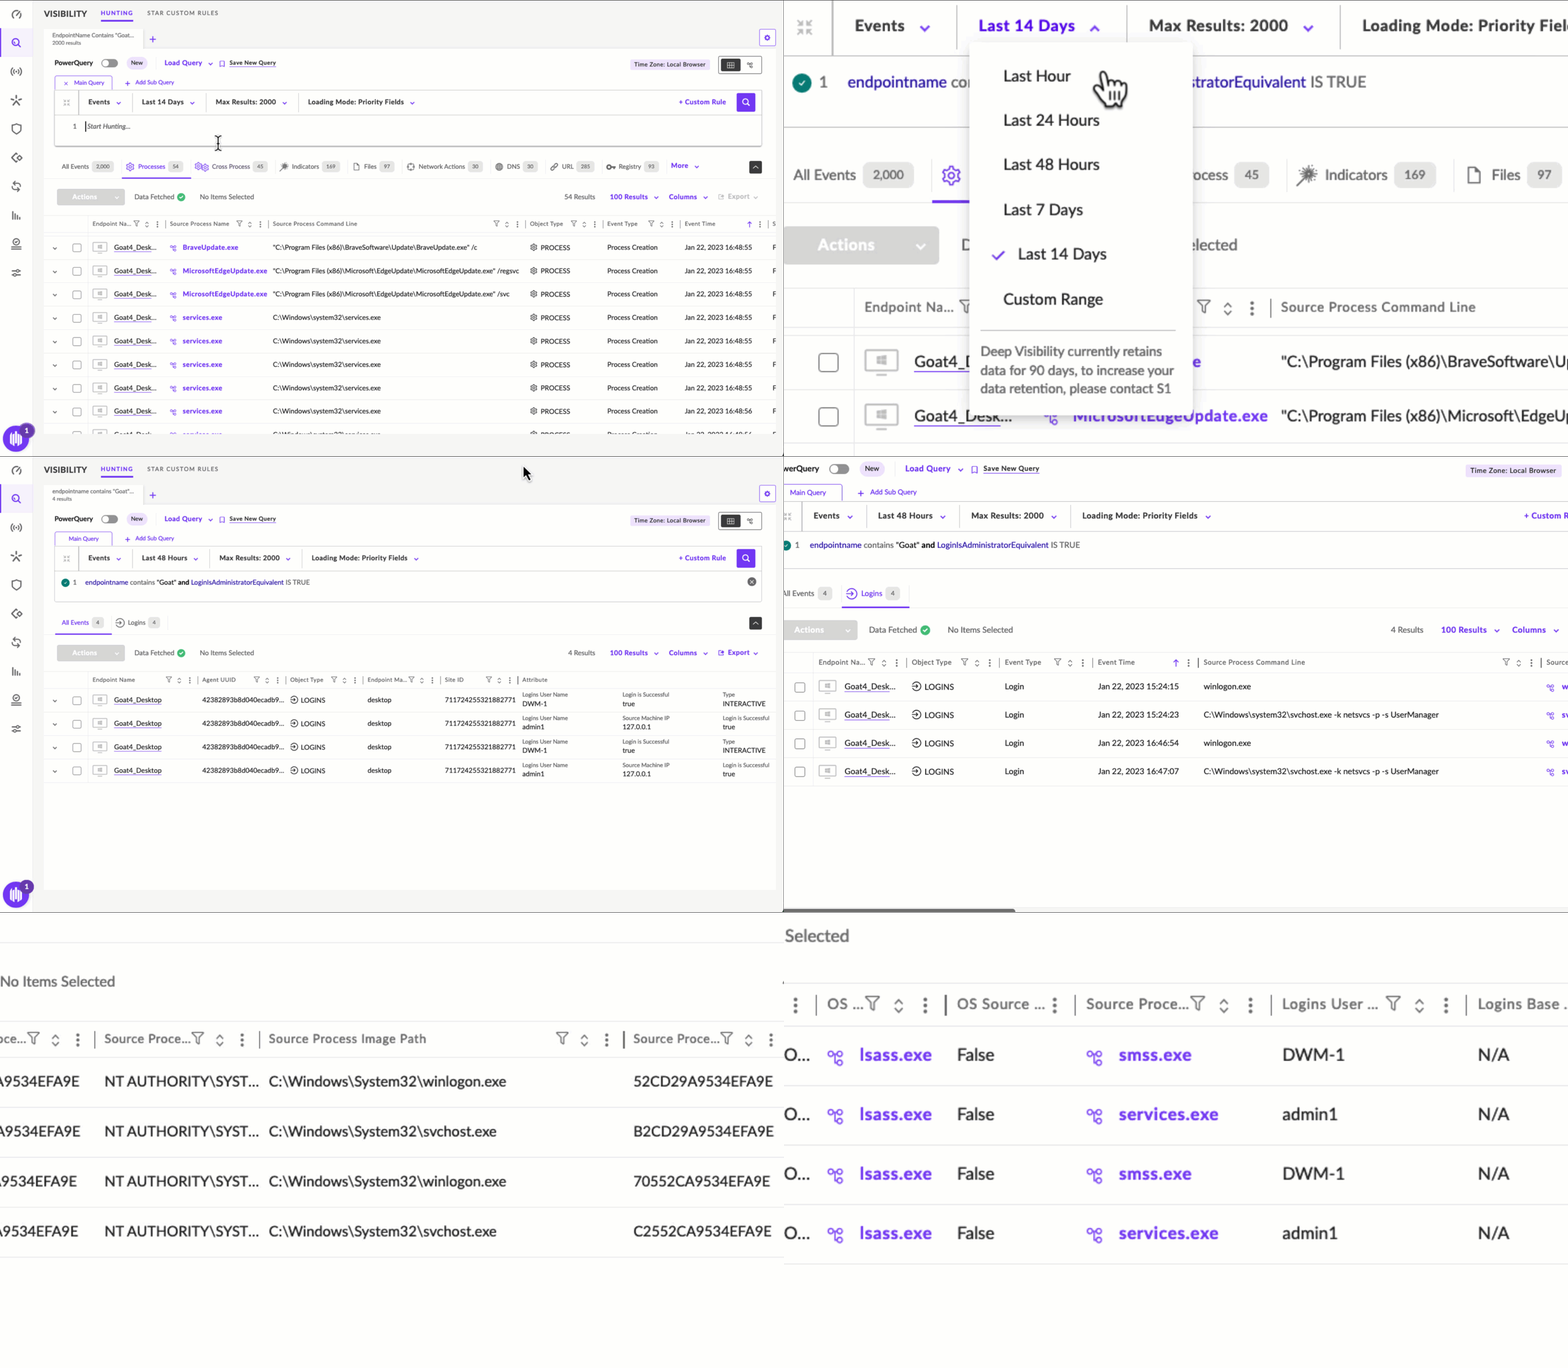
Examples of such queries are:
endpointname contains "Goat" and LoginIsSuccessful is TRUE
endpointname contains "server" and LoginIsAdministratorEquivalent IS TRUE/FALSE
SOC teams can further utilize this to enrich their attack data and quickly perform mitigation and hunting steps such as:
- Disable the compromised user
- Pivot to Deep Visibility to hunt for other malicious activity by the compromised user
- Potentially identify a vulnerable device by finding which machine belongs to the compromised user
How It Helps
Many incidents target individual hosts, from which attackers will attempt to further strengthen their access through lateral movement techniques. Monitoring login activity can help identify patterns of suspicious activity on the network. In the event of an incident, login data can help to more effectively identify the source and the extent of compromise.
3. Track Lateral Movement of Attackers
The ability to pivot from a single device point of view to an environment perspective, allows the SOC analyst to see the big picture. In most cases, attackers are trying to expand their foothold and move laterally from one device to other components on the network. Tracking this activity can be done with the SentinelOne console in the following way.
The SentinelOne Console provides visibility into lateral movement events directly within the context of an attack chain.

Lateral Movement events can be viewed quickly by opening the Incidents widget in the left-hand navigation pane of the console. Results can be filtered via the ‘Threat Details’ free text search.
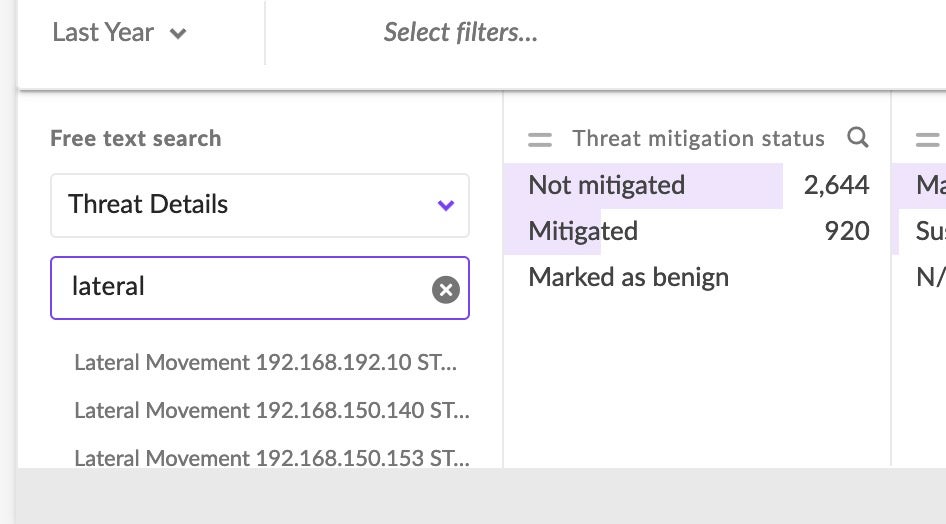
This view allows Lateral Movement events to be viewed exclusively, while also allowing analysts to ‘zoom out’ scope-wise to digest the full context of the event.
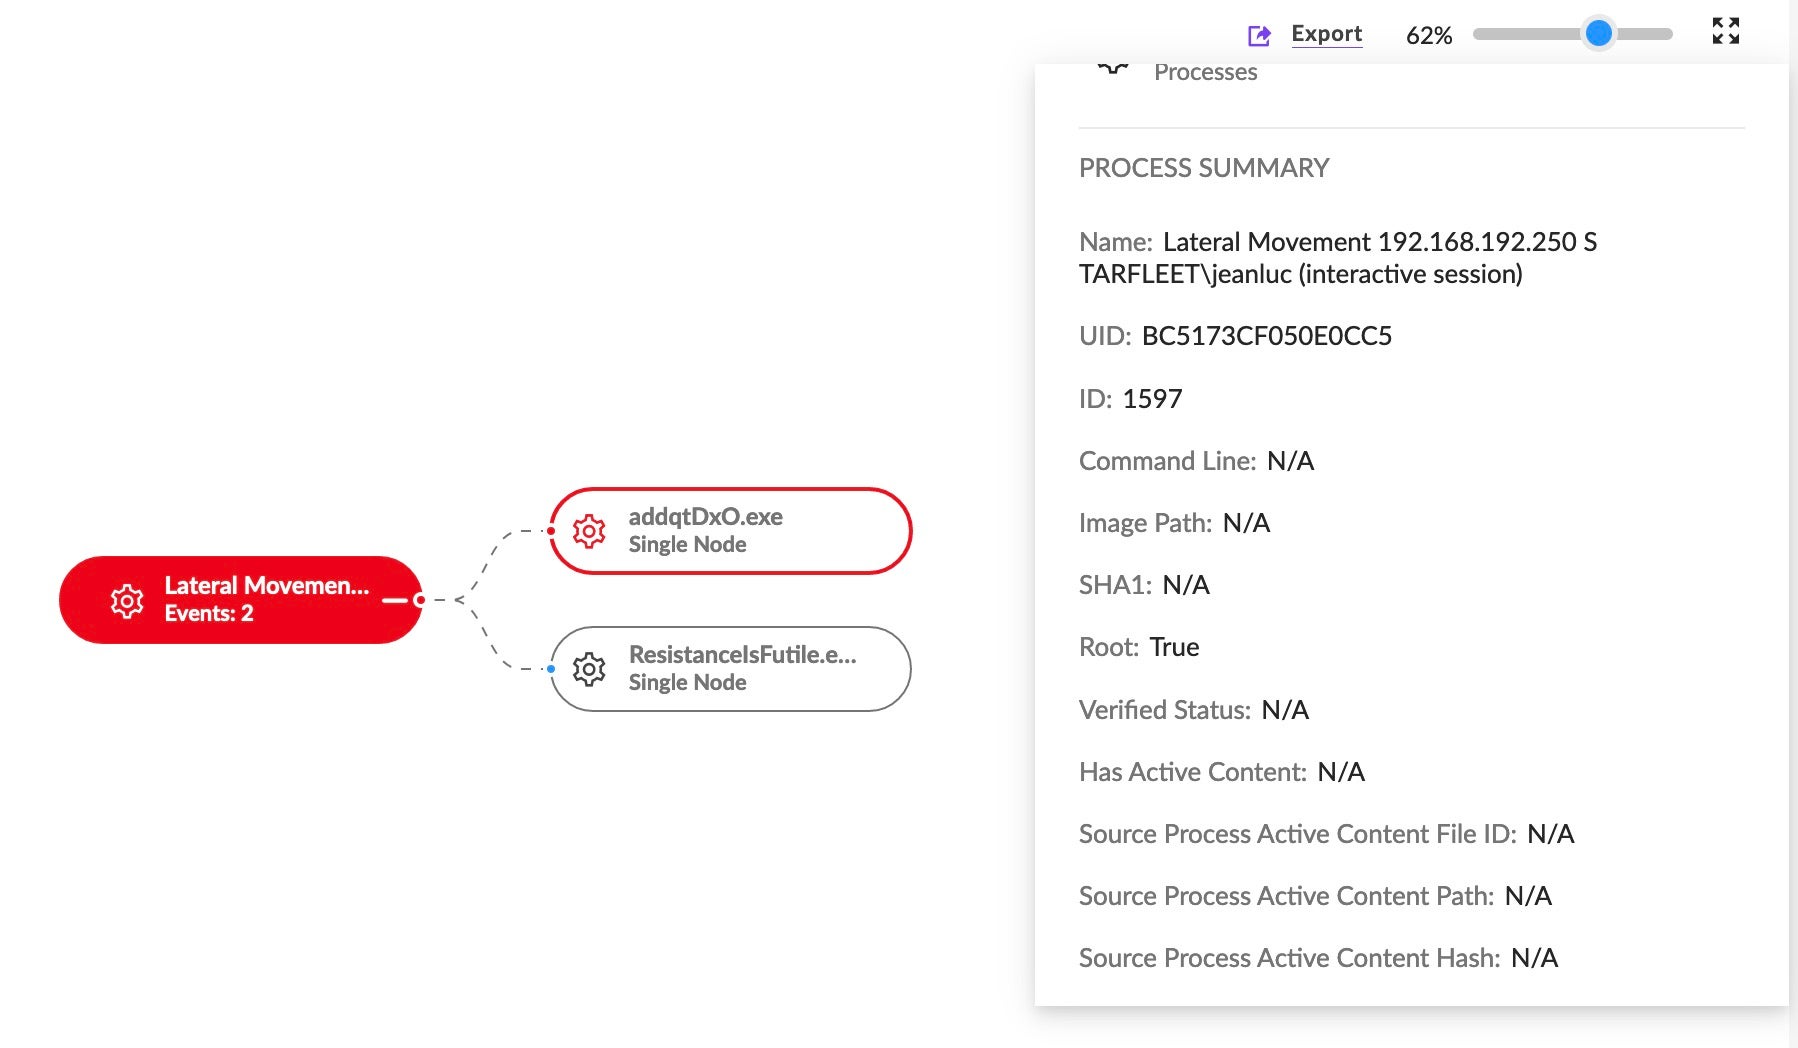
Analysts can also hunt for lateral movement events viewed in Storyline™ Additional Methods/DV Queries.
Further, PowerQuery can be leveraged in these scenarios, too. For example, attacks often create scheduled tasks to kickstart a lateral movement attack during work hours with privileges. Therefore, hunting for these events can lead to new discoveries or additional pivot points.
SrcProcCmdLine RegExp “shtasks” AND SrcProcName !=”Manages scheduled tasks”

Similarly, Deep Visibility can be used to hunt for high-level network behaviors, while also excluding traffic originating from SentinelOne processes. This can also be a good ‘starting point’ for discovering and analyzing anomalies in internal network traffic.
(DstPort = “135” or DstPort = “5985" or DstPort = “5986”) and (SrcProcDisplayName Does Not ContainCIS “svchost” or SrcProcDisplayName Does Not ContainCIS “SentinelOne”)

How It Helps
Lateral movement is one of the most common techniques used by sophisticated actors. These tips can help analysts readily identify and stop lateral movement attempts in their environments.
4. Understand the Scope of a Security Incident or Breach Attempt
Experienced SOC engineers know the feeling of investigating something only to realize later it was a single attempt or even a false positive. However, when you have access to all your environment telemetry at your fingertips, the likelihood of a wild goose chase is reduced. When the analyst suspects there has been a security incident, use PowerQuery to perform the following steps to identify the scope of the issue:
- Count the number of affected machines. This will give you an idea of how widespread the incident is.
- Track the communication between infected machines and any malicious command and control servers to identify the malicious actors behind the attack.
- Count failed login attempts by user name to identify potential initial access points used by the attackers.

How It Helps
Following these steps, analysts can quickly identify the difference between a major breach or an isolated event.
5. Find Hidden Threats by Examining Malicious Network Traffic
By analyzing network traffic, analysts can identify patterns or indicators that may indicate the presence of malicious activity, such as communication with known malicious IP addresses, unusual port usage, and protocols. Deep Visibility ensures analysts have full visibility into any artifacts dropped by specific URLs so they can assess whether they need to tweak firewall rules, denylist URLs, and others.
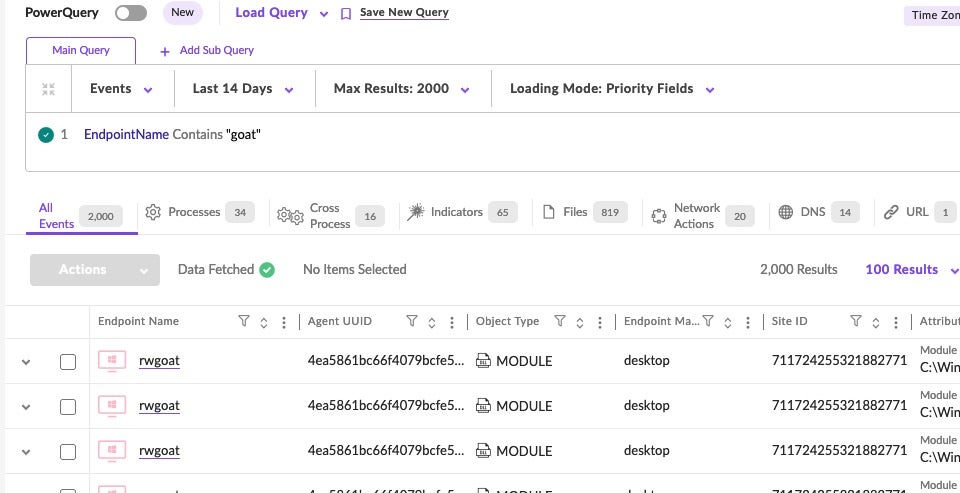
Enter an ‘open-ended’ query to view all event data, both malicious and benign, and then filter down the results as needed. Example: EndpointName Contains "<string>".
Next, click the ‘DNS’ tab to filter and view DNS request correlation.
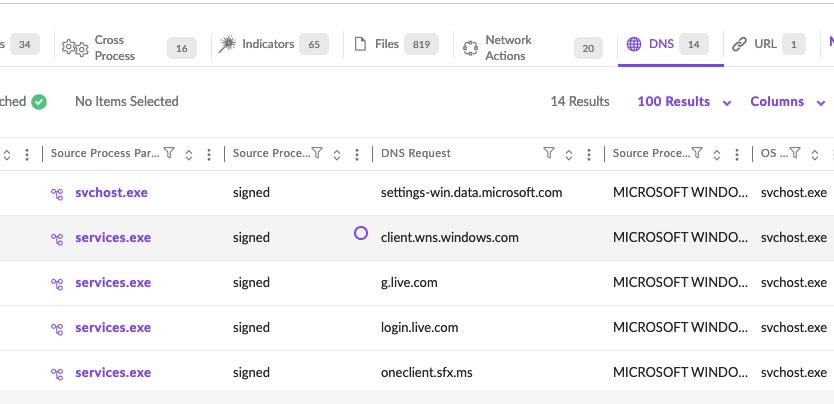
From the table of results, scroll horizontally to the ‘URL’ column and view all URLs associated with each endpoint.

How It Helps
Deep Visibility can help the security team to quickly identify potential threats, such as malware, phishing, and other cyber attacks, and take appropriate action.
Analyzing network traffic also can reveal data exfiltration attempts, where attackers are trying to steal sensitive data from the network. This can allow you to quickly identify the affected systems and data, and take action to prevent further data loss.
6. Use Visual Layers for Faster Triage
SOC teams can educe the triage process by expanding and moving freely between processes and their related graphs. The layering widget within Deep Visibility allows SOC analysts to maintain a cohesive visual context to support their investigations.
In the results table after a Deep Visibility search, if a process has a graph available, the name of the process shows with a hyperlink.

Click a link to open the graph in a new tab, then add or remove layers to the Process Graph via the Layers widget on the far right side of the XDR Process Graph.
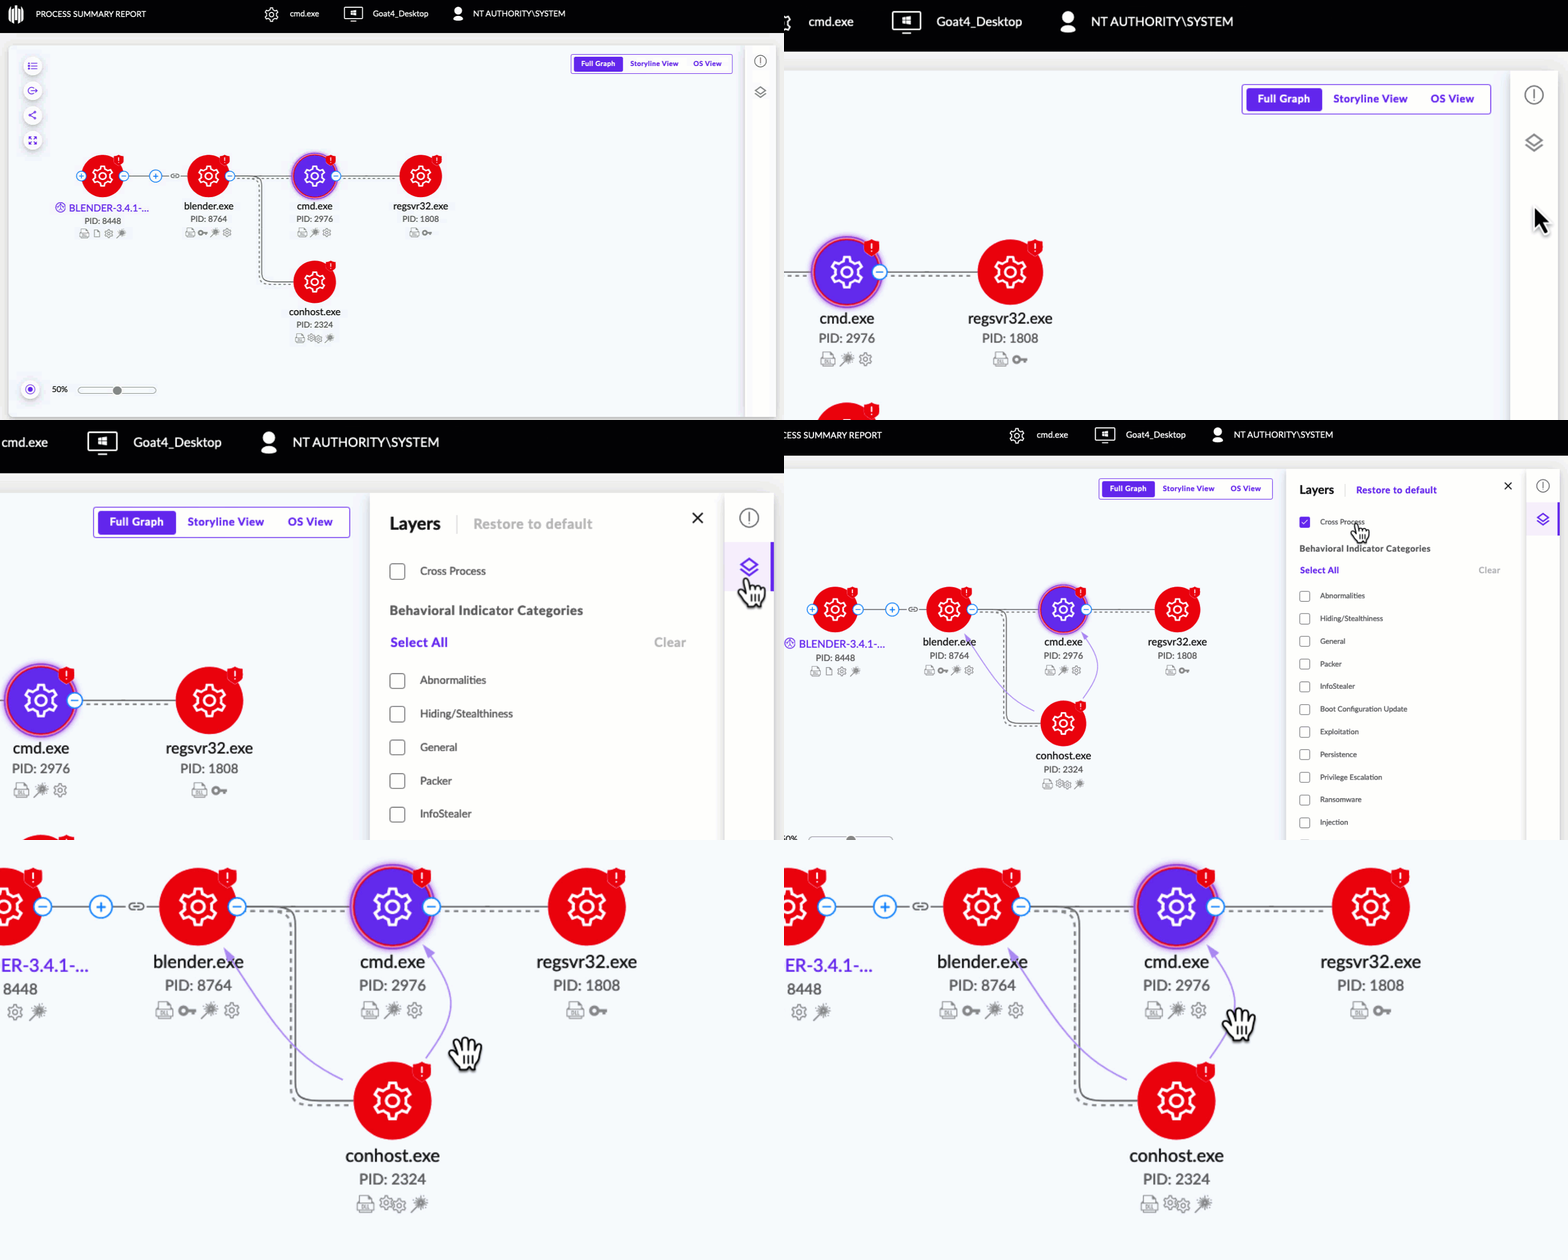
Selected layers are indicated on relevant nodes in the XDR Process Graph:
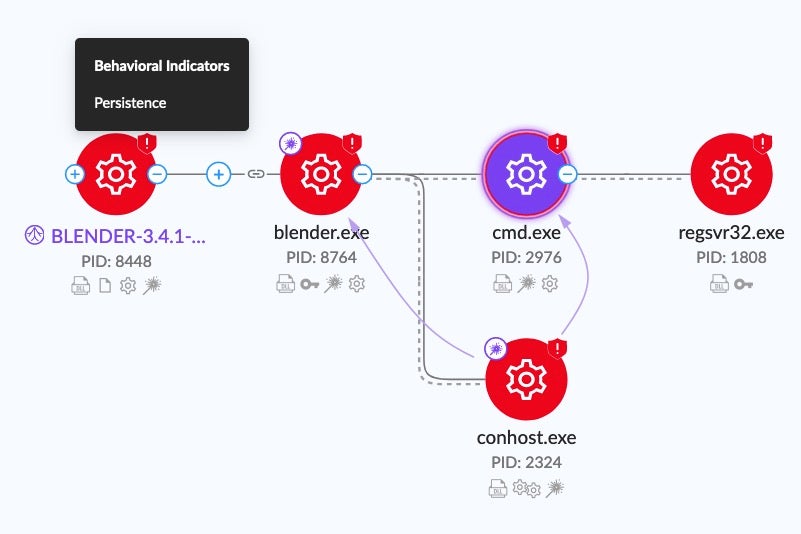
How It Helps
By enabling layers, analysts can quickly understand what malware is doing through visual highlighting of behavioral indicators associated with each process.
7. Find Vulnerable Applications in Your Environment
Common Vulnerabilities and Exposures (CVEs) fulfill an essential role in the identification and detection of vulnerabilities in the threat landscape. CVE identification by SOC analysts allows organizations to document and prioritize vulnerabilities, assess their severity through comparison, and track their cyber resilience over time.
To streamline the many tasks SOC analysts are responsible for, the SentinelOne console automatically inventories applications on an organization’s endpoints. High risk and vulnerable endpoint devices are clearly noted and correlated to CVE IDs, which are made easily visible with the console view.
In the SentinelOne console, navigate to the ‘Application Management’ page to see an at-a-glance view of all associated CVEs.
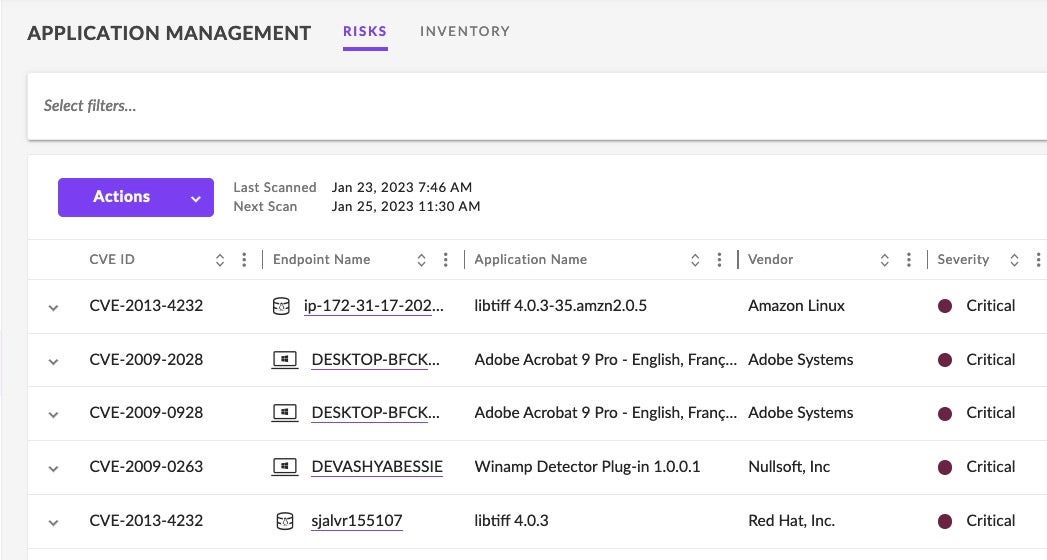
Select filters to sort by CVE severity, CVSS score, remediation level, and more. Multiple levels of filtering can be applied at once.
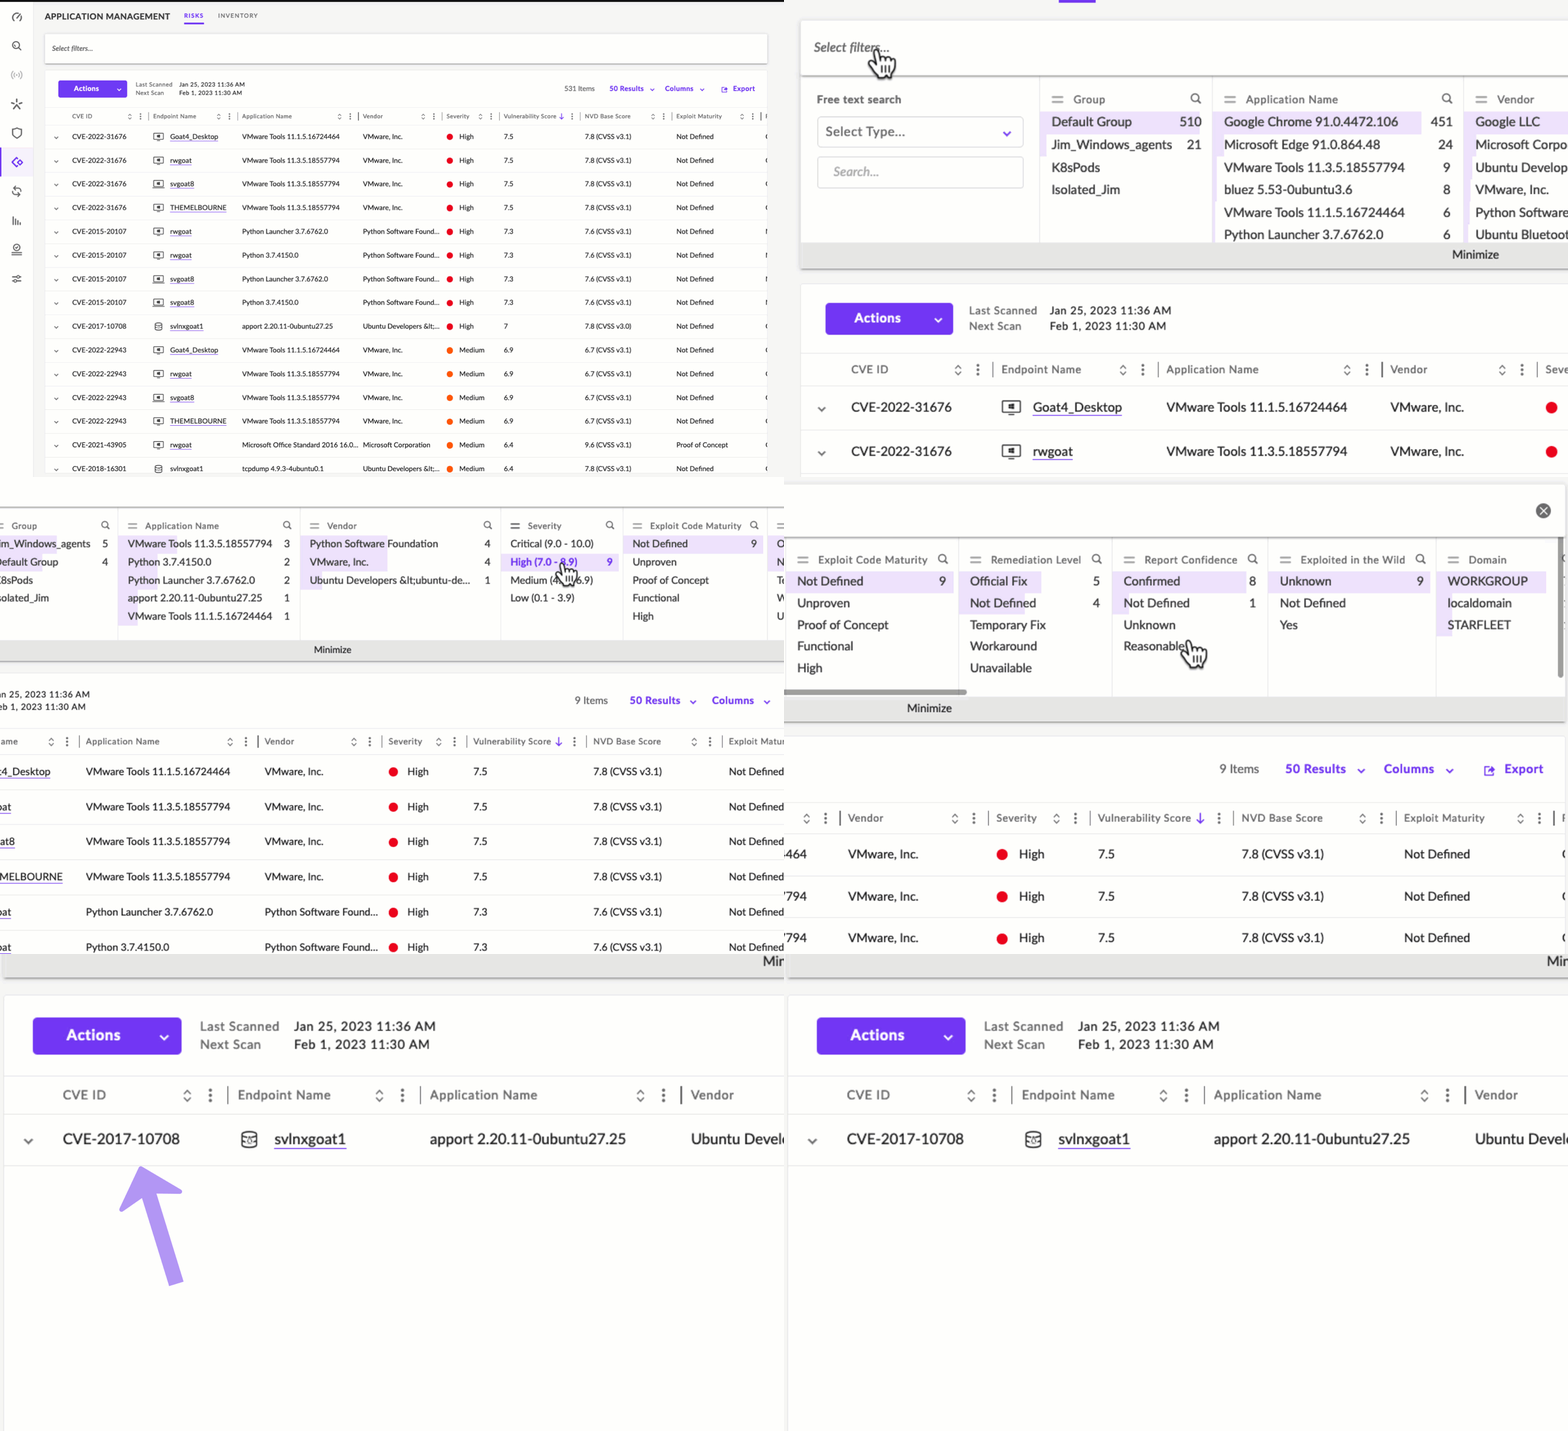
Filtering can be done via the ‘Select Filters’ widget. Filtering criteria includes Application Names, CVSS Score, Exploitability, Report Confidence and more.
How It Helps
Security and IT teams can use the Application Management view to identify vulnerable software and prioritize patch management.
Conclusion
Having the right people, with the right skills and the right tools is a large part of the battle in defeating the huge range of different cyber threats businesses now face. Ensuring that analysts are maximizing the tools at their disposal is critical. In this post, we’ve explored some of the ways that analysts can improve their productivity, efficacy and success in preventing, detecting and remediating threats.
There is a wealth of further information in the product documentation, including examples and further use cases. To find out more about how SentinelOne can empower your SOC team, contact us or request a free demo.
如有侵权请联系:admin#unsafe.sh